It is nothing new anymore that visual content is indispensable for convincing the customer to buy. AR brings a new level of marketing experience and creates many new ways to present products. The user now dives into a digital world of a product and is able to experience it before buying. An emotional connection can be build and used as persuasion.
While the place for information of physical products is nearly always limited, with AR there is infinite place and possibilities to give more information about the origin, production process or other background knowledge about the product.
AR in the field of marketing can be used to
• give a better user experience • bring pagaging to life • tourism • fashion • …
Best practices
Packaging of beverages When using the app and turning the camera on the beverage can, an entertainment clip will be shown. This method can also be used to show for example the ingredients of the drink.
IKEA: The Swedish furniture shop offers an AR-app to their customers to place the furniture into their home. Compared to seeing the products printed on paper, this way makes the decision easier and also brings a fun factor with it.
PEPSI For the champagne Unbelievable Pepsi AR is used to entertain people waiting for the bus on the station. This is done by a transparent monitor instead of the conventional advertising space on the bus stop. It seems like just seeing through the glass but virtual elements will be added.
In his Ted Talk about “How beauty feels” Richard Seymour affirms the importance of creating context to achieve a joyful or “beautiful” experience. As an example he mentions lights in cars slowly turning off. “I’ve never found anybody that doesn’t like the light that goes out slowly. I thought, well what the hell’s that about?“ – Richard Seymour. [1]
Lights slowly turning off in cars are a perfect example of a subtle but joyful experience. In general, people describe this experience as natural, or just nice. But there is much more behind this experience design than just a nice “gimmick”. Lights slowly turning off – light to dark in six seconds – in fact, this experience perfectly imitates the experience of going to cinema or theater, which triggers a sense of relaxation tempered with anticipation. When the lights turn slowly dark within six seconds when being in cinema or the theater, that is exactly the moment of experiencing great anticipation – this characteristic gets automatically stored in our unconscious mind and therefore in further consequence connoted with a positive feeling. This theory even gets strengthened through the fact, that the experience of the lights turning slowly off in 6 seconds was experienced much more positive by people who are used to go to cinema or the theater. [2]
Hence, to create something joyful we have to trigger an emotional response – often aroused through poignancy, which can too trigger a sad emotional response. „It isn’t just about nice. And this is the dilemma, this is the paradox of beauty.“ as Seymour states. Joy can be aroused through triggering good, bad (pathos), exciting (triumph) or even frightening emotions. [3] Those emotions arise in our unconscious mind, even before we can manipulate them – smart design takes that knowledge in consideration to guide the experience.
A story, a work of art, a face, a designed object — how do we tell that something is beautiful? And why does it matter so much to us? Designer Richard Seymour explores our response to beauty and the surprising power of objects that exhibit it.
It is hard to find universal characteristics of joy or beauty. As mentioned in the previous post, there for sure is something like an universal experience of beauty, which is deeply related to our evolution. Related to evolution is humans fascination for:
Pastoral landscapes (= safe, propitious and liveable environment)
Skilled performances (= increase status, desirable personal qualities: intelligence, conscientiousness, access to rare materials)
Rare materials, Symmetry (= wealth)
However, there is much more to consider in addition to this “predefined fascination” – particularly the details lie in our individual experiences, knowledge and preferences, that we develop over time. By injecting meaning and context to experiences, we trigger an emotional response:
Happiness, Compassion, Surprise, Amazement
Which can lead to a joyful experience. The creation of meaning and context can be achieved by considering elements that refer to our universal values, collective knowledge and/or individual preferences.
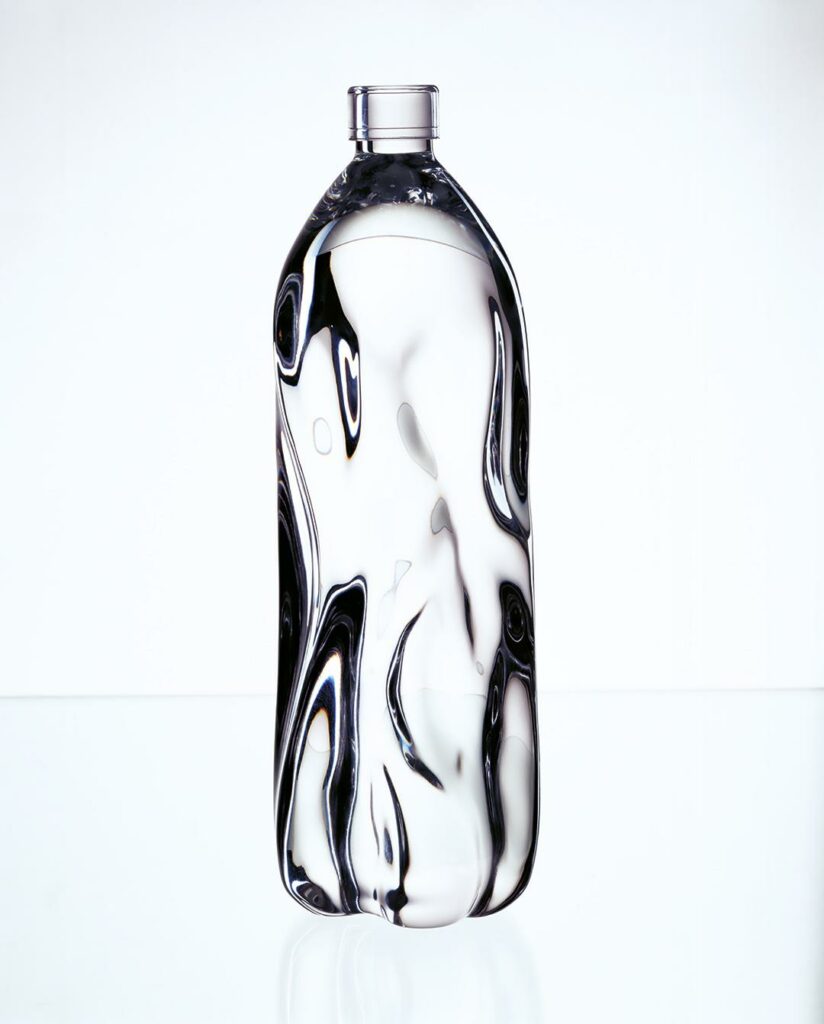
A water bottle by Ross Lovegrove [4] – pretty close to intrinsic beauty – an embodiment of water, something refreshing and delicious. People who are aware of how hard it is to design and produce a bottle of this shape enjoy this product even more.
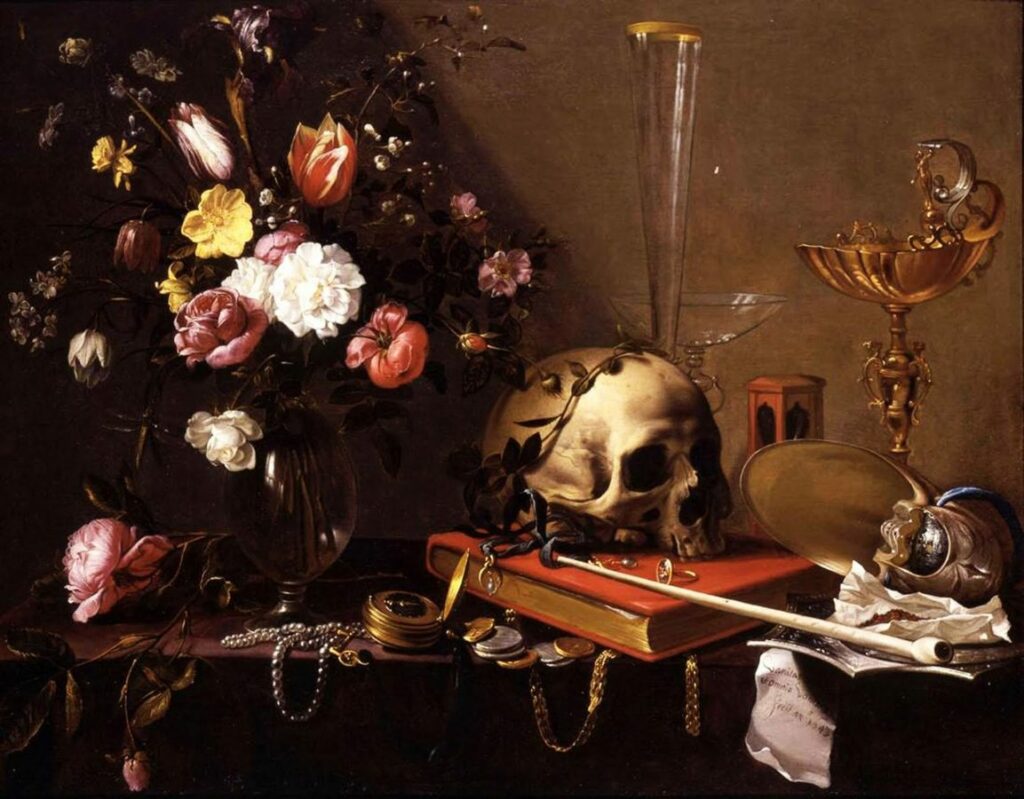
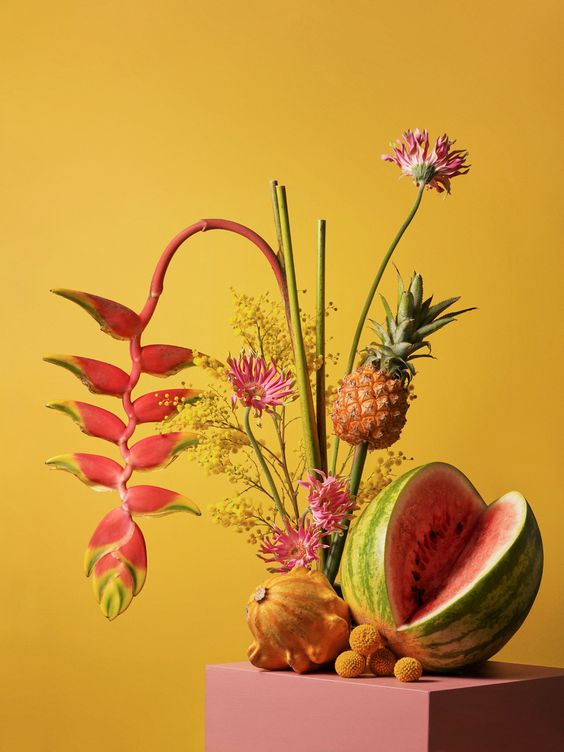
Almost all symbols or allegories are understood ambiguously. The meaning or allusion interpreted by the viewer only emerges within the context of the picture. The use of symbols in still lifes manifested itself in the 17th century. During this time still life painting experienced a high and during this time the use of the right motifs and what they mean played a major role. Even today, one would love to experience the vision of every design / photography and what it means. Thus, symbolically charged objects are still used in still life photography. In addition, it seems to be modern even in still life photography to increasingly use the classically defined subjects.
Examples:
Broken vessels stand for the vanity of everything earthly and the commemoration of death.
Flowers: transience of splendor and beauty, revelation.
Halved or bitten: refer to a fall, but also to the senses or taste.
Books: vain science or useless pastime.
Money: love that can be bought, often alludes to the female gender.
Sliced lemon: questionable, symbol of the externally beautiful and internally deceptive.
Things upside down or upside down: empty life, death.
Effect of colors in photography
According to the photography legend Alexander Spoerl, a colorful photograph has the worst color effect. In photography, three possible types of design have become established with regard to color.
1: Conventional coloring, which is based on the objective appearance of the object.
2: Creative coloring, in which the attempt is made to achieve the “effective” color, does not have to be the same as the real color of the object.
3: Symbolic coloring, does not adhere to objective or effective color, but aims at the message of the end result.
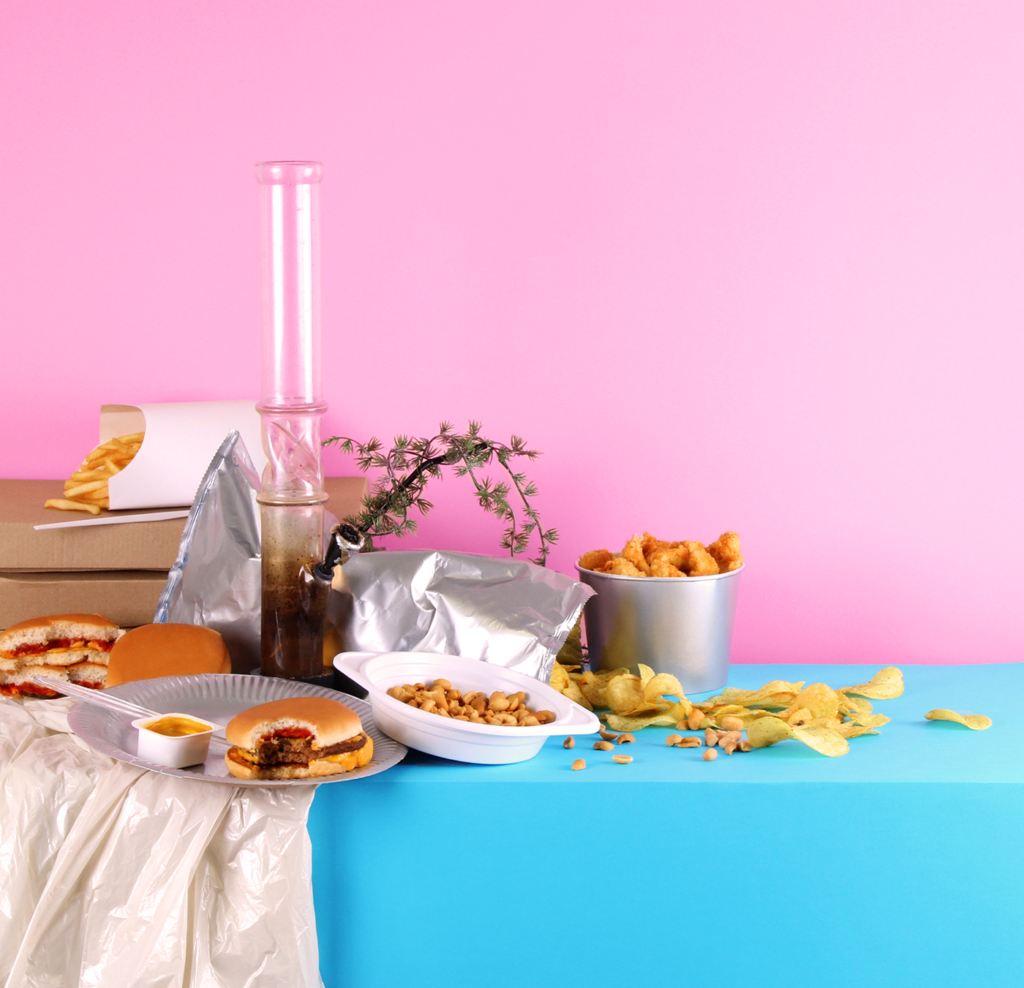
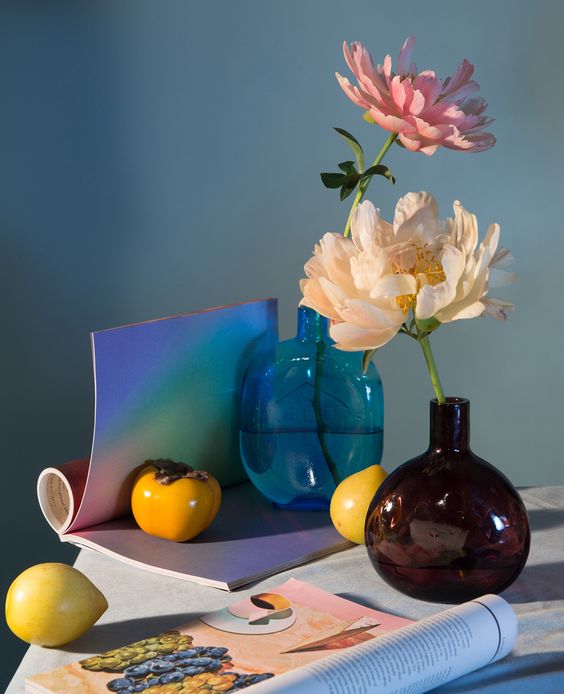
Color is essential for the subject and therefore also for photography. In contemporary photography it can be seen that the common colors of our everyday life are by far not as exciting as unnatural colors. A strong and saturated picture beats pale tones by far. Delicate and soft pastel tones can be more pleasant to look at for a long time, but they are not as attractive at first glance. Shades that differ only by delicate nuances are very difficult to use. In addition, photographs in black and white or grayscale are less noticeable, unless they have a strong and concise contrast. However, the use of strong colors can also be a hindrance if one does not pay attention to the relationship between color and object. Furthermore, the color must support the meaning of the motif and be useful.
In the case of creative coloring, it is important to ensure that it is chosen in a way that is understandable. In addition, different materials have a different effect with different colors. It is advisable to choose an unusual color mood for not every material. This can irritate the viewer and lead to displeasure. Objects that can be used for creative coloring in still life photography are usually described as cheap, impersonal and short-lived.
Beispiele für Farbsymboli
Examples for the symbolic of colors
Red stands for energy, passion and danger / orange stands for creativity, youth and enthusiasm / yellow stands for happiness, hope and spontaneity / green stands for prosperity, stability and harmony / blue stands for trust, calm and intelligence / purple stands for luxury Mystery and spirituality
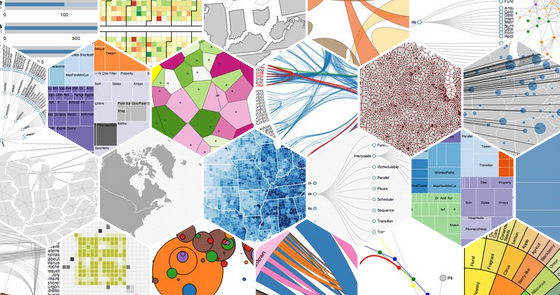
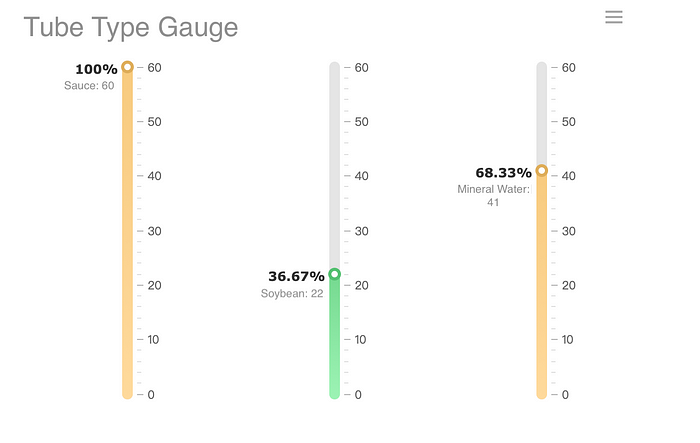
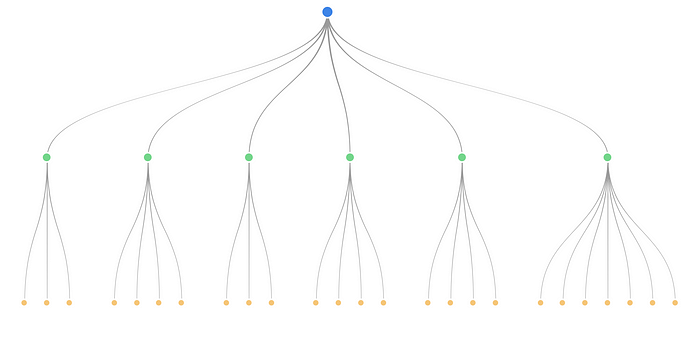
Um Daten zu visualisieren gibt es verschiedene professionelle Tools. Diese werden, je nach Anforderungen kategorisiert. Diese sehr komplexen Tools bieten eine Vielzahl an Report und Visualisierungsmöglichkeiten.
Code Tools
Visual Reporting or BI
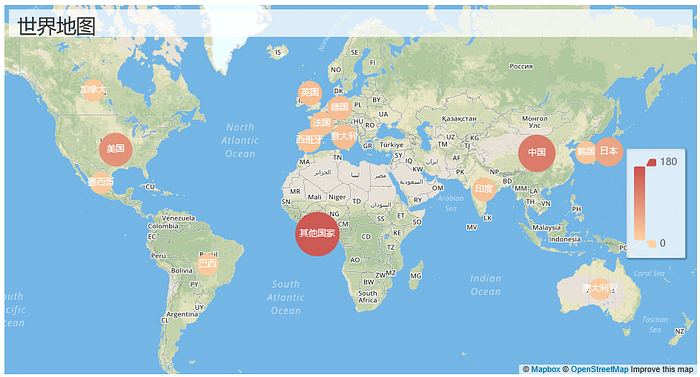
Maps
Infographic Tool
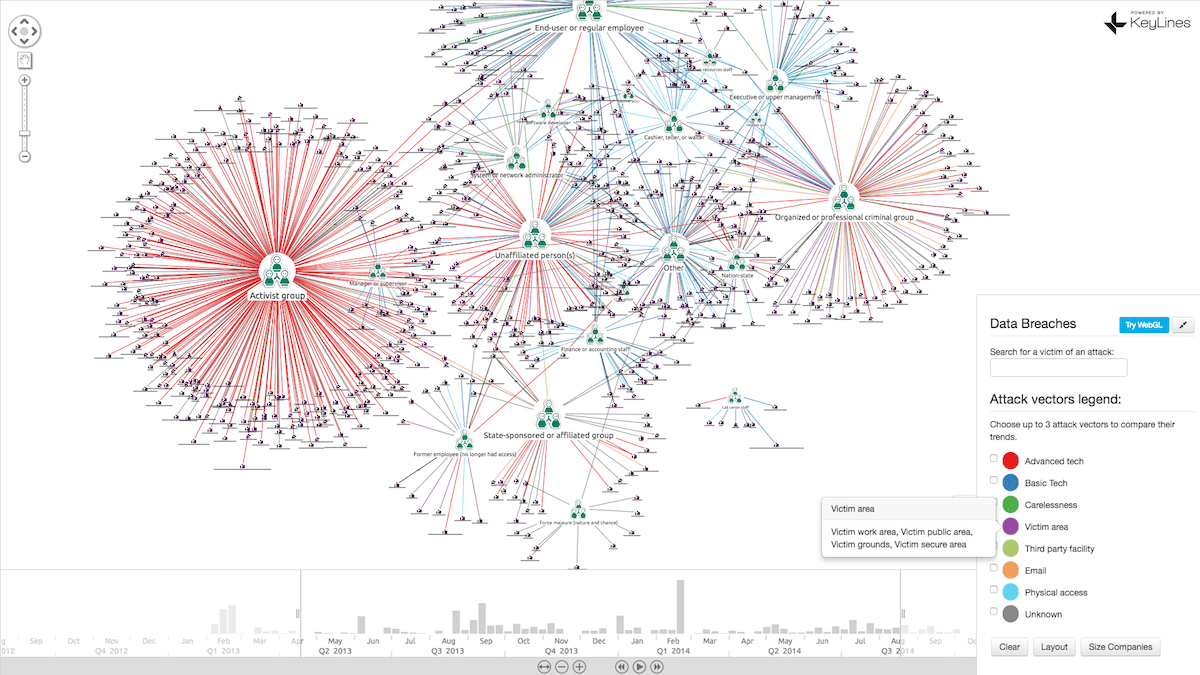
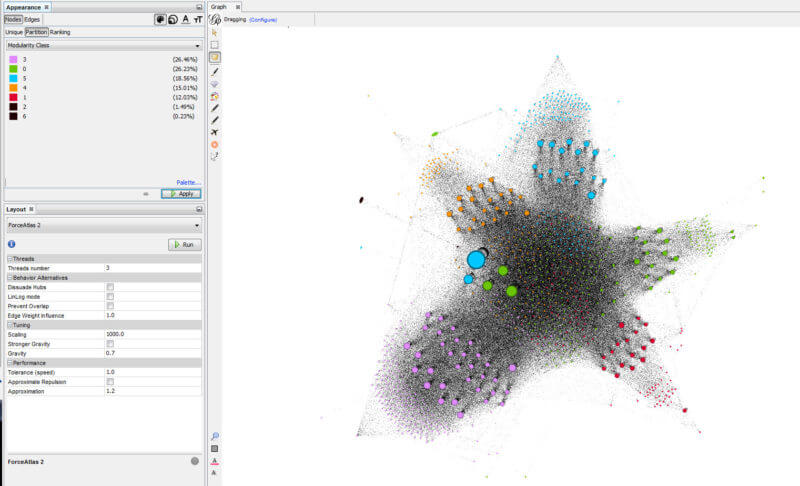
Net-work graphs
Large-Screen Visualization
Code Tools
D3.js
Open Source JavScript library mit verschiedenen Visualisierungsmöglichkeiten (HTML, CSS, SVG)
From finereport.com | D3.js
Plotly
From finereport.com | Plotly
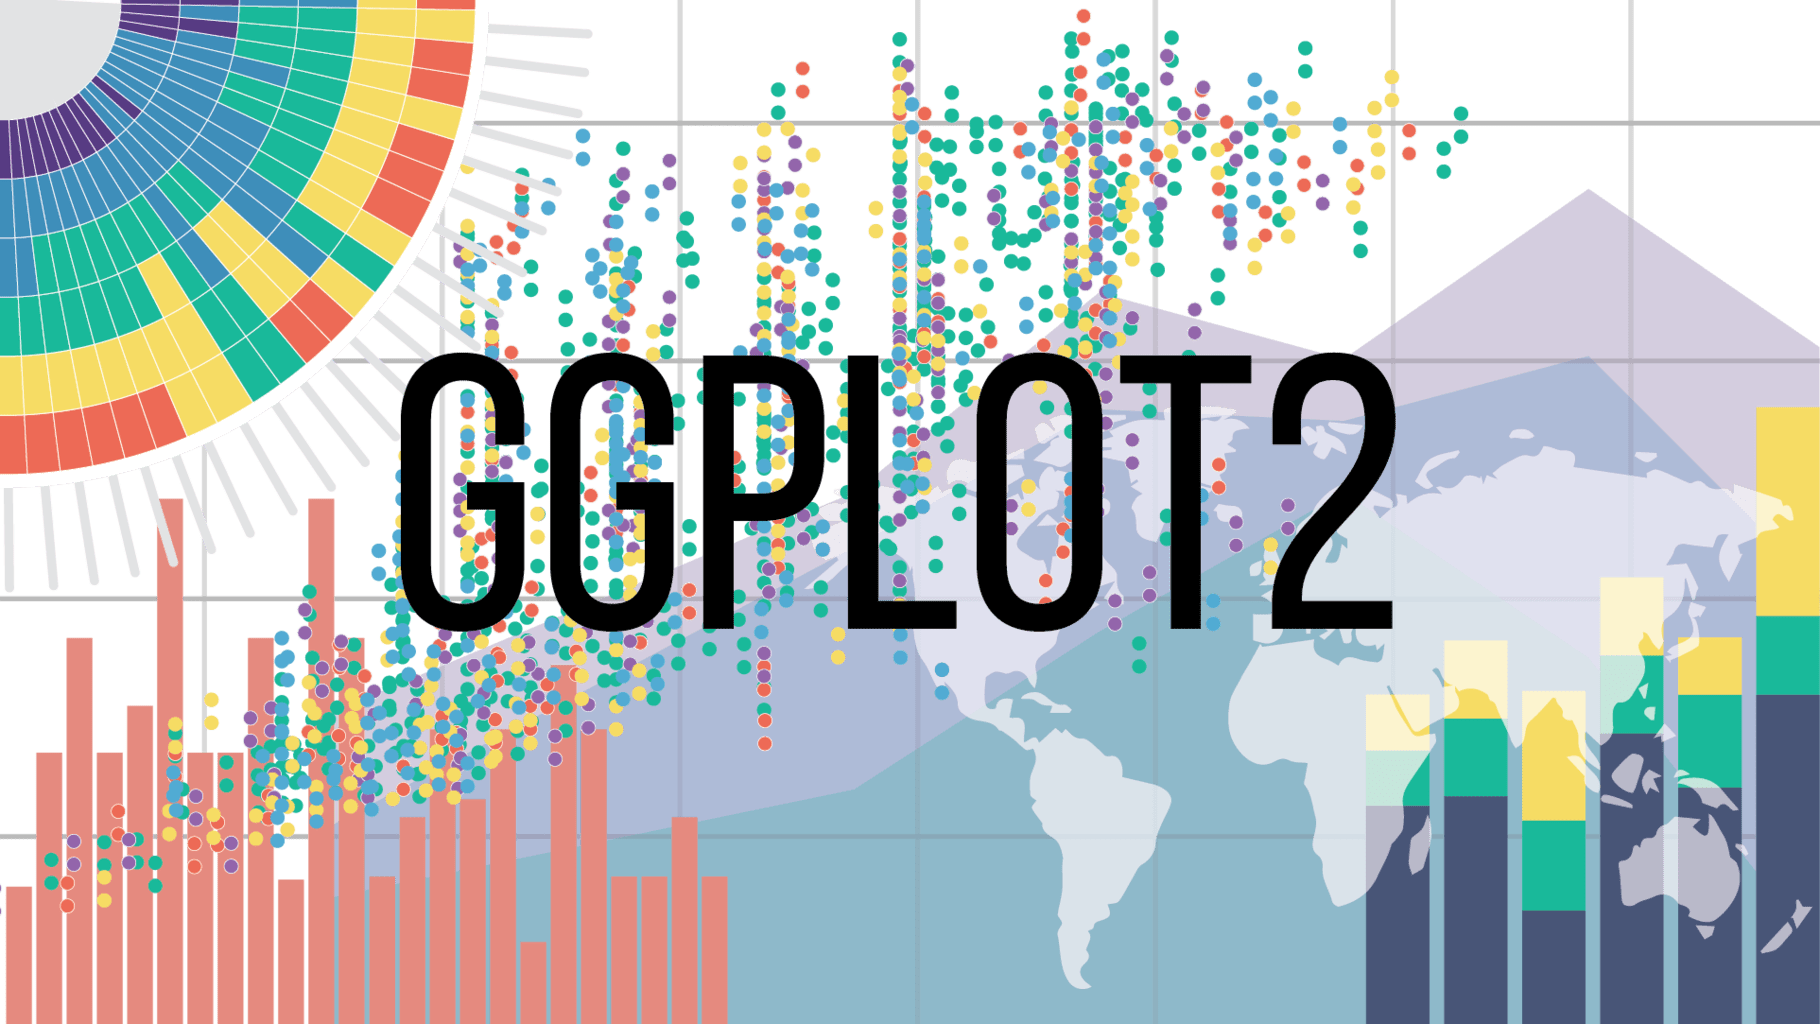
gglot2
From finereport.com | ggplot2
Visual Reporting or BI
Excel
From finereport.com | Excel
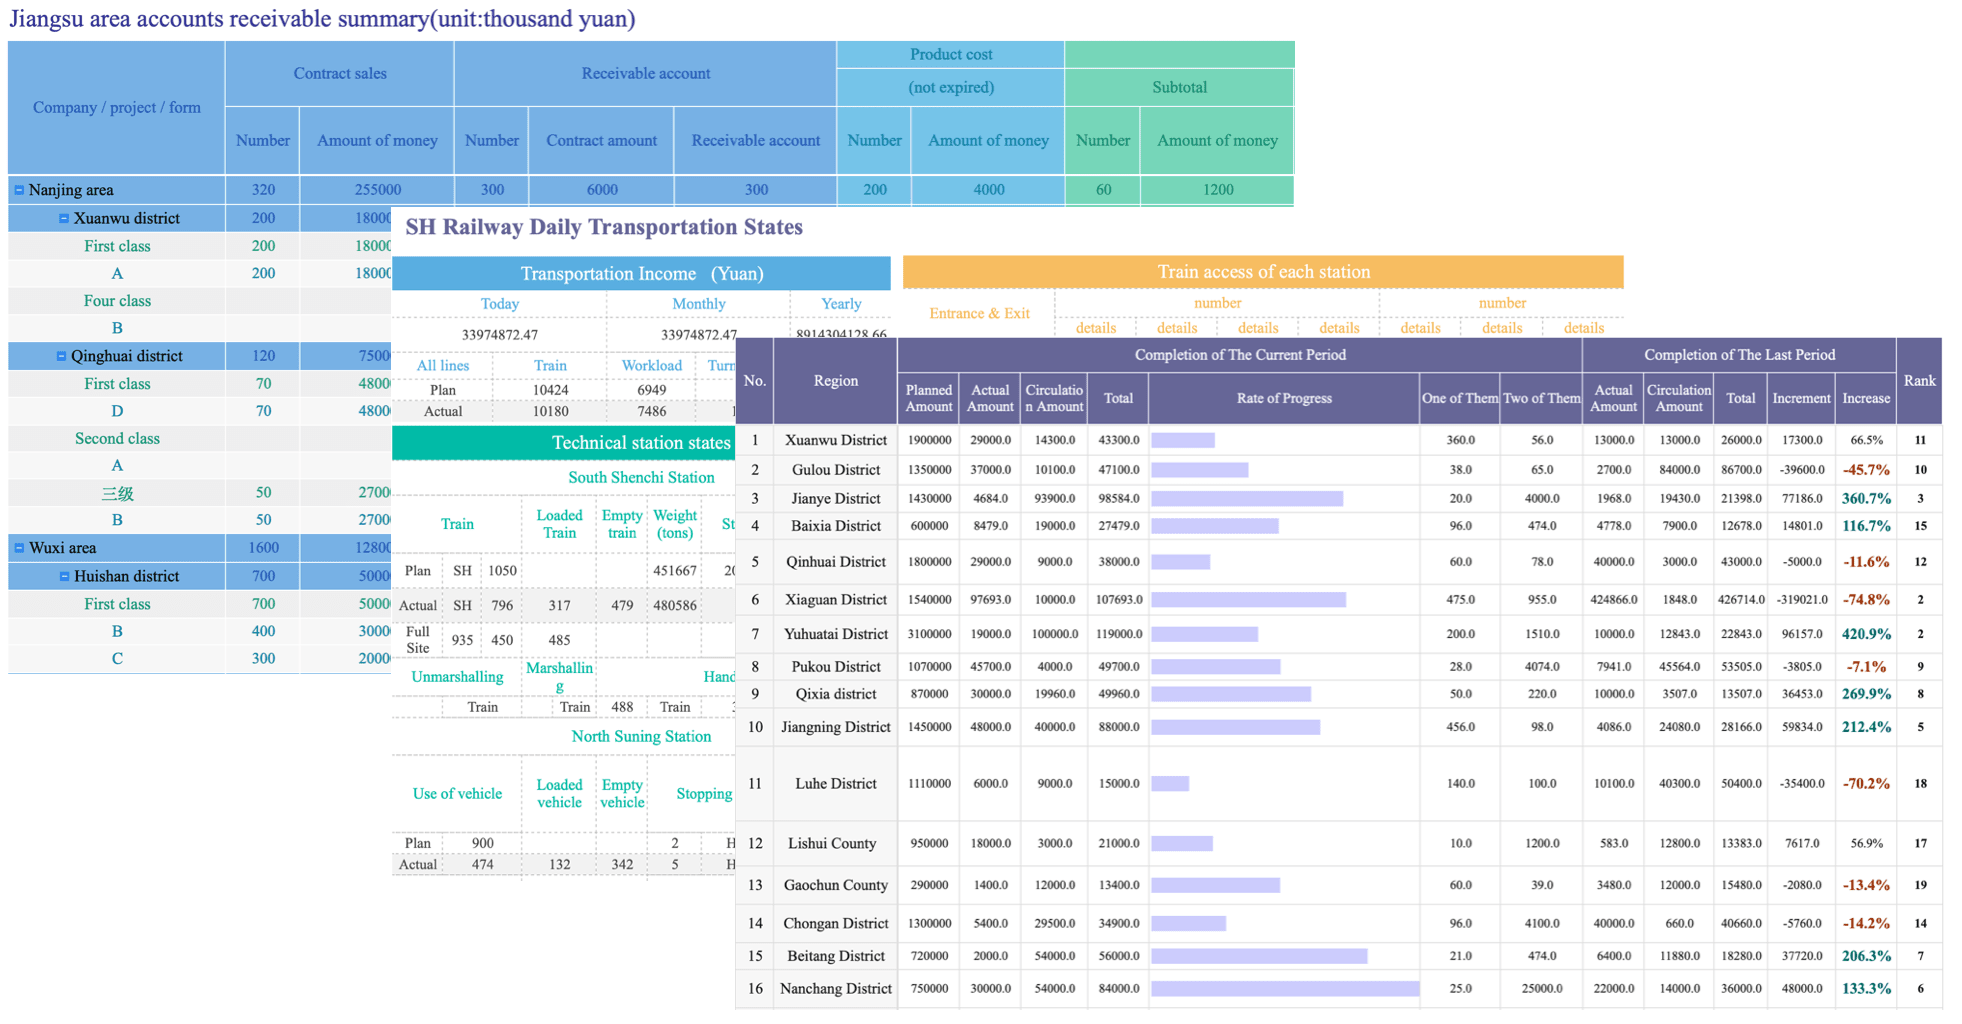
FineReport
From finereport.com | FineReport
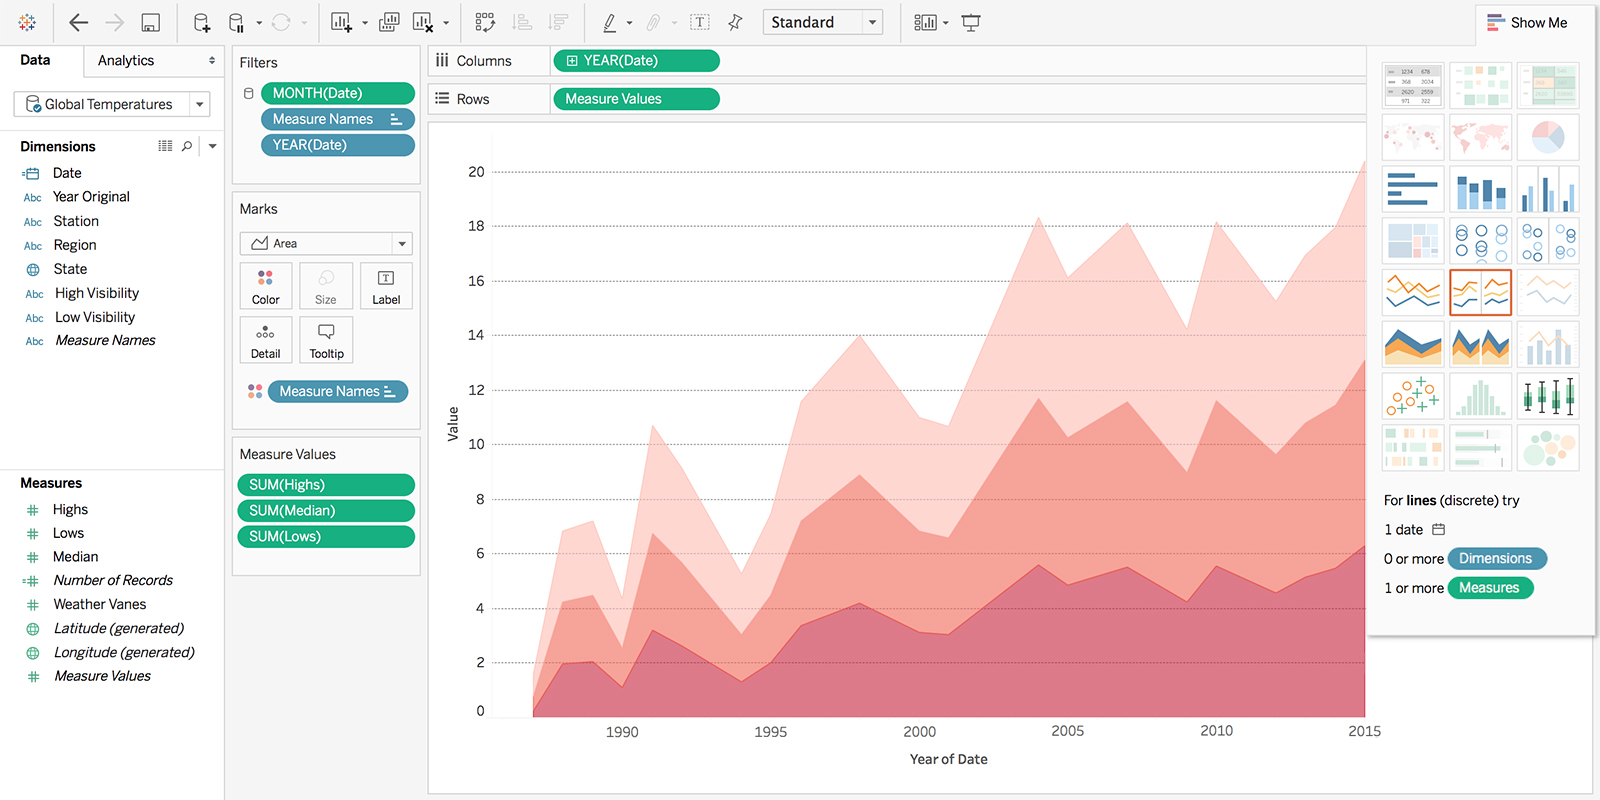
Tableau
From finereport.com | Tableau
Maps
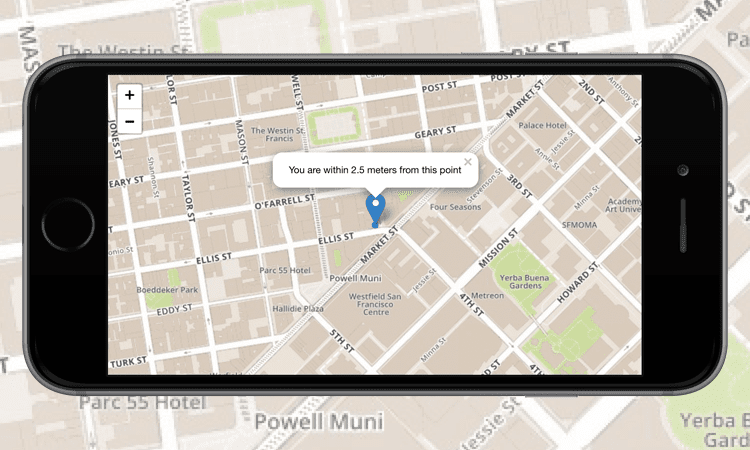
Leaflet
From finereport.com | Leaflet
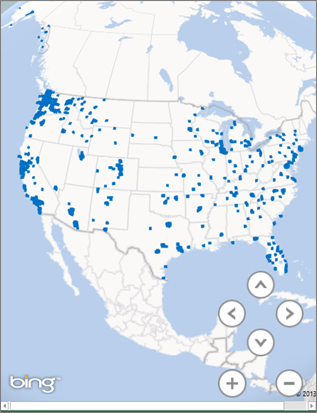
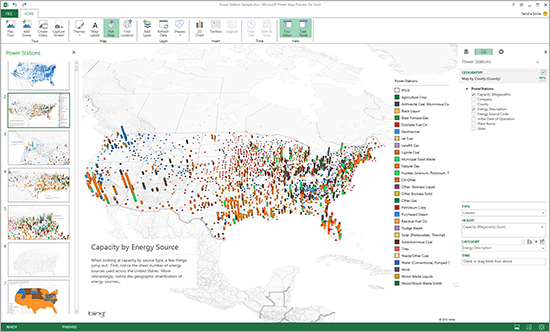
Power Map
From support.microsoft.com | PowerMapFrom finereport.com | PowerMap
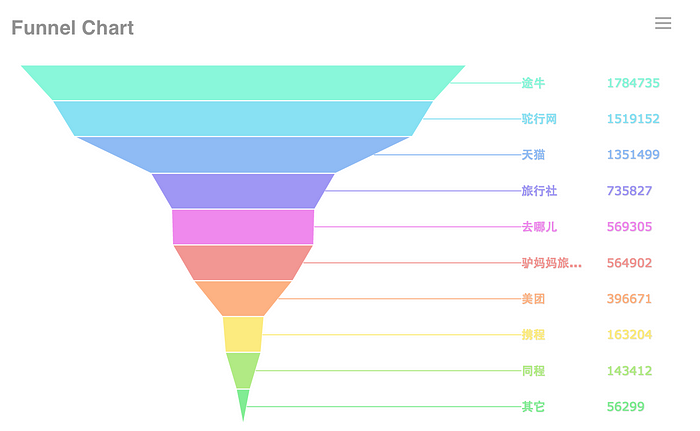
Wie schon im vorherigen Blogeintrag beschrieben gibt eine Vielzahl an Diagrammtypen. Manche sind sehr einfach gestaltet, andere wiederum sehr komplex. Jedoch spielt die Verständlichkeit dabei eine viel größere Rolle als Komplexität.
What is the main and the most obvious difference between design in 2000 and 2020? Availability and existence.
Twenty years ago, users were not yet tempted with modern technologies. There were much fewer products, the variety was not boring yet. And each new product was innovative, opening new horizons and, important, exciting.
As we know, The World Wide Web system was invented near 30 years ago by Tim Berners Lee. His aim was to help people in faster and easier way share information all over the world. Now it has changed significantly. We don’t want just to share information nowadays. Interface should be user-friendly, environmental-friendly, clickable, fast, modern, colorful and convenient. We want technologies to work fast, without any bugs — ideal, so to say.
Web has start deeper involving in society and reflects the changing fashions, beliefs and technologies of the time.
First Design
The first website contained only text with hyperlinks explaining what the web was, how to use it, and basic set-up instructions. From those early days to the present, web design has taken a long and winding journey.
Firstly, possibility of adding images in 1990, later — Flash. Flash was a software platform that allowed designers to incorporate sound effects, video and animation into websites, making for a more dynamic audio-visual experience. Flash also gave designers more freedom to make websites interactive. This was indeed the era of a creative and technological breakthrough in web design. Splash pages, decorative animations, and beautifully rendered bubble buttons dominated the web design trend to make people stare.
People became sophisticated at browsing the Web, and the design elements no longer had to educate in a way that visually articulates the functionality, such as blue underlined hyperlinks.
Flat Design
Fast forward to 2010 when a new web design approach called responsive web design was created by Ethan Marcotte. This introduced a different way of using HTML and CSS.
The main idea underpinning responsive design was that a single website could respond and adapt to different display environments, facilitating use on different devices. People would have the same experience on their mobile device as on their desktop computer, meaning increased efficiency in web development and maintenance.This led to another wave of web design trend: flat design. A minimalist approach to design for usability was at the forefront. To put it otherwise, the bet is made on user comfort. This is a pronounced protest against Skeuomorph . The choice fell on more simplified and aesthetic solutions.In the modern world, designers need to create not only high-tech extensive functionality without visual overload, but also think not only about what we can do, but rather about what we should do. That means being considerate about how design can affect the people who use it, and designing websites that result in positive experiences for users.
Im Design hat man als Ausgangspunkt immer einen Inhalt oder Information, die man kommunizieren möchte. Um diesen Inhalt herum wird ein System aus visueller Sprache und grafischen Mitteln und Prozessen geschaffen, um diesen Inhalt optimal nach außen zu tragen. Jedes Element fügt dabei etwas zu diesem Inhalt hinzu – you add content to content.
Für Design ist die Kommunikation von solchen aussagekräftigen Informationen von entscheidender Bedeutung, wobei die Art der visuellen Sprache eine entscheidende Rolle spielt und dem gesamten Design eine eigene Inhaltsebene hinzufügt. Im Vordergrund steht hierbei immer die Nachricht, die kommuniziert werden soll, weswegen die visuelle Sprache auch in Hinblick auf diese ausgewählt werden sollte.
Ideen und Information
Der Zweck des Grafikdesigns besteht darin, einen nützlichen, funktionalen Zweck zu erfüllen. Es ist normalerweise kommerzieller Natur, aber nicht immer.
Hierbei wird auf Grundlage eines Marketingplans ein Sujet erstellt, mit dem das Zielpublikum angesprochen und dort eine gewünschte Reaktion ausgelöst werden soll. Illustration und Fotografie als Werkzeuge sind auf jeden Fall starke Träger für Emotionen. Und positive Emotionen sind die ersten Träger für Kaufimpulse der Kunden.
Hier arbeitet oft ein/e TexterIn mit einer/einem DesignerIn zusammen, um die visuellen Bilder mit gut ausgewählten Worten zu unterstützen. Dabei gilt, dass bei allen Arten der Kommunikation – sei es die sprachliche durch Worte oder die bildliche Nachricht durch Fotografie oder Illustration – eine Nachricht mit Bedeutung gesendet wird – im besten Fall sollte diese bewusst gestaltet und geformt werden.
Illustration und Fotografie als rhetorisches Mittel
Visuelle Informationen sind ein mächtiges rhetorisches Mittel, wenn sie im richtigen Kontext eingesetzt werden. Im besten Fall bringen sie die Betrachter und Konsumenten dazu, Entscheidungen zu treffen.
Wie im Blogpost über „Visual languages im Communication Design“ schon angesprochen, hat jedes der bildgebenden Elemente eine informative bzw. inhaltliche, visuelle und symbolische Ebene. Für GestalterInnen ist es wichtig, durch die richtigen visuellen und mentalen Kanäle ein Design zu schaffen, das das Zielpublikum anspricht. Dies ist einerseits über die Form und andererseits über den Inhalt einer Darstellung möglich.
Die Form – die visuelle Ebene
Die Art und Weise, wie etwas aussieht oder das physikalische Aussehen, ist Form. Bilder, die visuell anregend sind, lösen bei den Betrachtern eine physiologische Reaktion aus. Form ist schön.
Diese Form wird im ersten Schritt bereits durch die Auswahl der bildgebenden Elemente und deren charakteristischen Merkmale beeinflusst, wobei bereits eine gewisse Richtung und Stimmung gesetzt wird. Wie bereits erwähnt wirkt Illustration als Medium an sich anders als Fotografie.
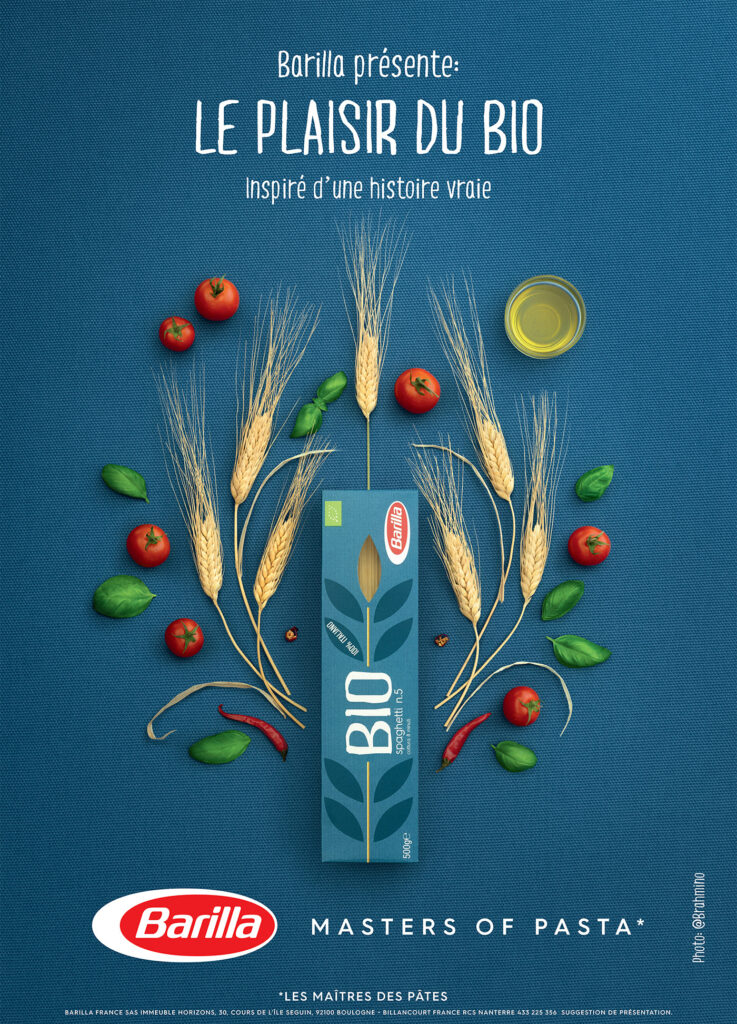
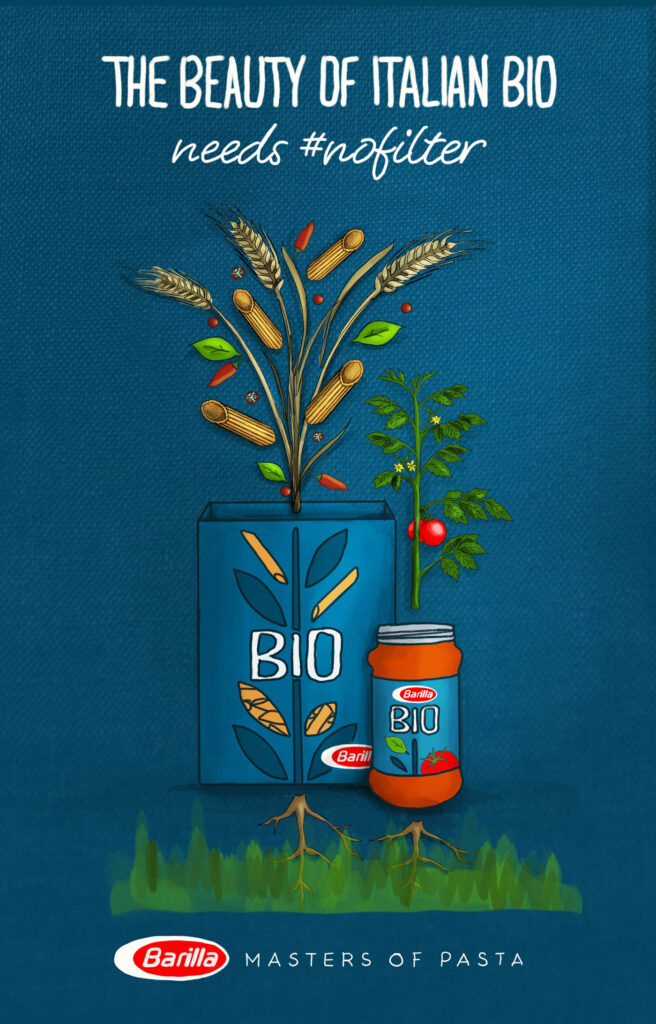
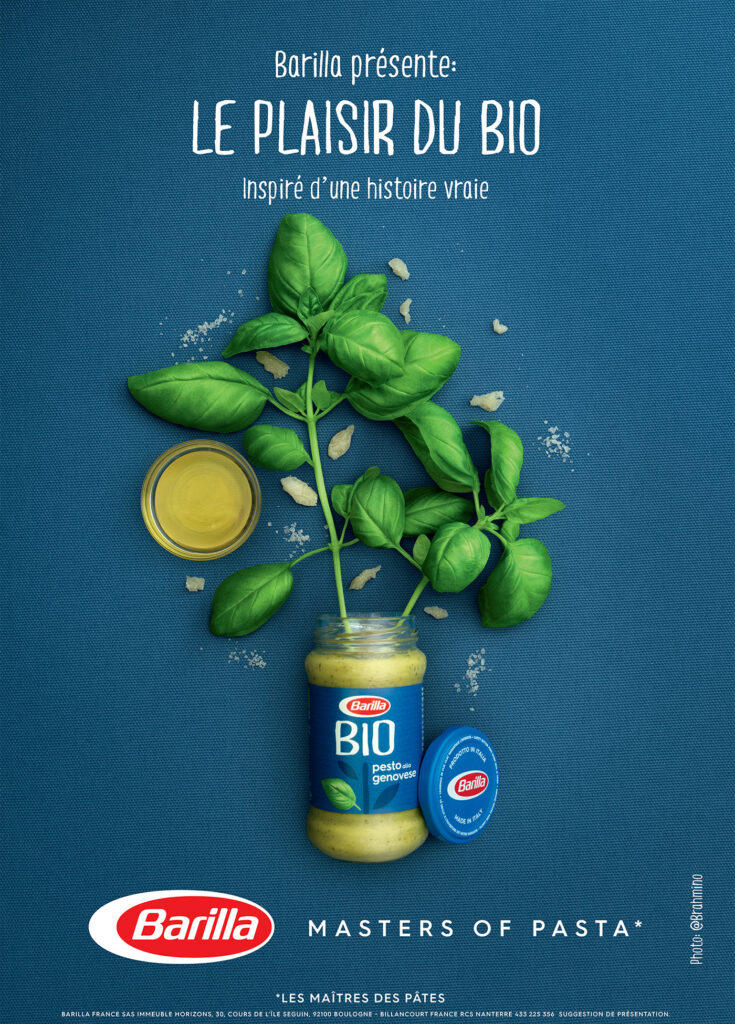
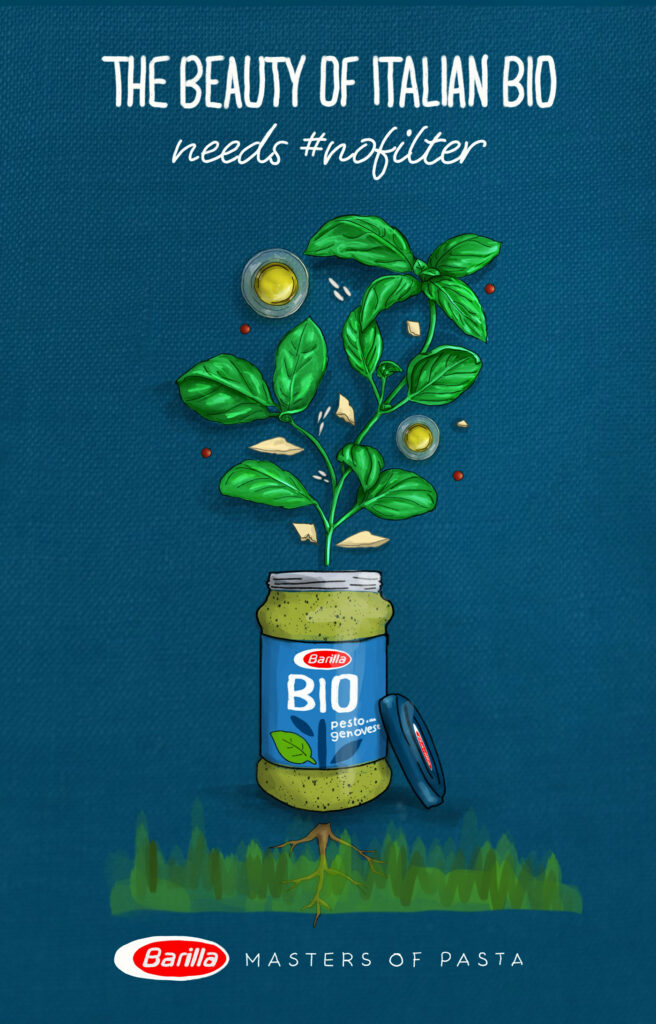
Barilla Werbeplakat: Illustration und Fotografie im VergleichBarilla Werbeplakat mit FotografieBarilla Werbeplakat mit Illustration
Der Inhalt – die inhaltliche Ebene
Was etwas sagt oder welche Ideen eine Sache kommuniziert, ist Inhalt. Bilder mit bedeutungsvollen, wörtlichen Botschaften provozieren eine psychologische Reaktion, die auf symbolischen Assoziationen basiert. Hier gibt es Möglichkeiten, spielerisch, subversiv und intelligent zu sein. Inhalt ist nützlich.
Wie man an den Barilla Werbesujets sieht, ist hier der Inhalt gleich, jedoch wird durch Illustration und Fotografie als Elemente jeweils eine andere Stimmung geschaffen bzw. visuelle Sprache gesprochen.
Die symbolische Ebene
Jedes bildgebende Element hat eine symbolische Aussage, diese hängt sowohl mit der inhaltlichen, als auch der visuellen Ebene zusammen.
Bei Grafischen Bildern bzw. Illustrationen wird bereits aufgrund ihrer Charakteristiken eine symbolische Ebene geschaffen – sie repräsentieren Ideen oder Konzepte. Fotografien im klassischen Sinn stehen eher für Wahrheit und bilden bzw. schaffen Realität.
Zusätzlich können in beiden Medien visuelle Metaphern, Allegorien, bildhafte Symbole, Farbe und dergleichen eingesetzt werden, um dem Bild eine weitere symbolhafte Aussage zu geben.
Everybody thinks online marketing is an easy job due to all the social media that are available to us. Just share your releases on Facebook and Instagram, they say. But there is actually so much more work behind a successful promotional campaign, especially if the budget is tight/non-existent. This article will discuss all the possible ways of free promotion, including the timeframe for one campaign. Before starting this process, it is essential to have a digital distributor (for self-releasing).
The first 2-4 weeks of a release promo campaign are what comes before actually releasing anything. The artist should upload their work through their distribution service as a pre-release and set a later release date. This time during the pre-release will be used to garner Spotify saves that are beneficial for the algorithm, as well as pitching your work. It will be important to find promoters, playlists and curators who are willing to include your release on their channels in order to gain you a bigger following post-release. The reason why we leave so much leeway before the release date is because it takes promoters time to come across your submission. Sometimes it can take even 6 weeks. My favourite submission networks for this are LabelRadal and SubmitHub. The first platform gives you access to both labels (if you have unreleased music to pitch) and promoters with YouTube channels, who will share your work if they like it. On SubmitHub, you will find different types of curators- Youtubers, instagram influencers, and Spotify Playlists. Both of these networks allow you to pitch to a certain extent for free, but better features come with a subscription. However, most of the time, I could get away with sticking to the free version, especially on SubmitHub.
The next step is to figure out your social media campaigns. Have a total of 3 announcements- the day of pre-release, one day before the official release, and then finally the day of release. This way you will build up hype and interest. Also, make sure you are always active on your social media and have quality content that grows your following, as well as keeping your engagement up. If your social media is a bit dead, you won’t generate many streams from promotional posts.
Now it’s time to think about Spotify specifically. I focus on this platform because it has shown the most results for my efforts. After the official release date, you will have to search out playlist curators and build real connections with them. This way, you will have someone to come back to time and time again for each next release. Make sure to offer some sort of value proposition to curators, not just blindly begging them to playlist your tracks. Start with smaller playlists and build your way up as your streams grow.
The next thing in mind is to always keep up with how streaming platform algorithms are changing. For example, Spotify recently announced that they will be pushing out artists who agree to forgo some of their streaming profits in return for promotion. This could actually make the popular artists even more popular and the smaller ones will stay small, because they cannot afford to cut their already small profit.
TikTok has become a really important gateway to potential fans. Adding your tracks to their library opens up the possibility of your track going viral. For example, tiktokers tend to come up with trends that are copied by many other users on the platform. Often, these trends include a specific track or song. It is important to make sure that music you are submitting to TikTok is either “memeable” or that is has a potential for popular appeal.
Lastly, if all of this seems too complicated or like a lot of work, I would suggest one more step that is paid. This step may help you get much further, as it takes away the promo burden off of you and let’s you focus on music production instead. Get yourself a virtual music manager. One great example is https://www.thevirtualmanager.co.uk/ which have a monthly fee of 24 GPB, or 240 for a yearly plan (2 free months + a free 1-on-1). Personally, I consider this the next step after self-promotion, which will open many more doors for your music.
For all of the steps to work, be realistic to yourself and objectively determine whether your music is of high quality or not. Quality comes before anything else.
Discussing with an artist how best to depict a mechanism or process — what to include and exclude, how molecules, stars or fossils should be positioned relative to one another — can help researchers to hone their hypothesis, reveal points of disagreement between authors and even identify holes in understanding.
Jyoit Madhusoodanan
In her article Science illustration: Picture perfect Jyoit Madhusoodanan wrote about the experiences different scientists had while working with (scientific) illustrators for their papers and how “enlisting the help of an illustrator can add impact to research papers and outreach projects”.
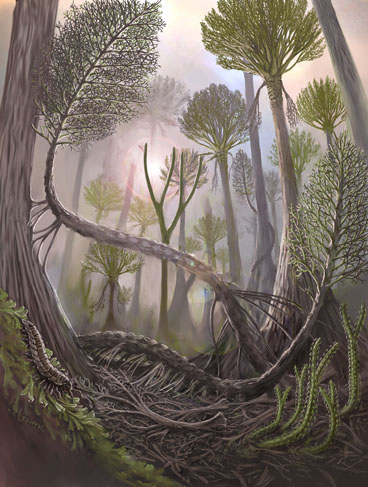
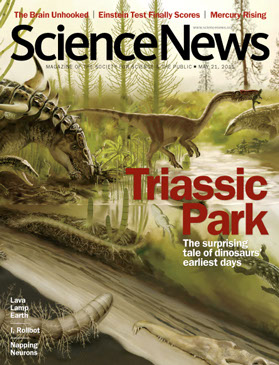
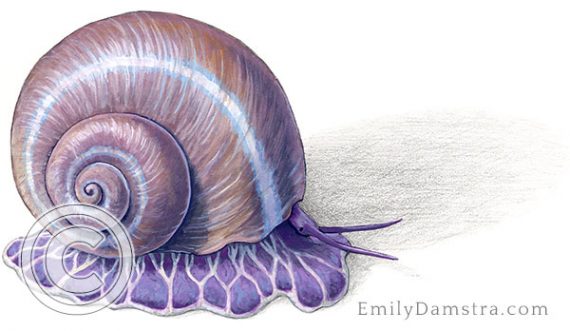
Lost Worlds by Victor Leshyk
One of the mentioned scientists was the palaeobotanist Christopher M. Berry, who researched the Gilboa Fossil Forest in New York, the home of the Earth’s oldest forest, for years. The tree trunks fossils found there are roughly 380 million years old and the only known survivors of their type in the world.
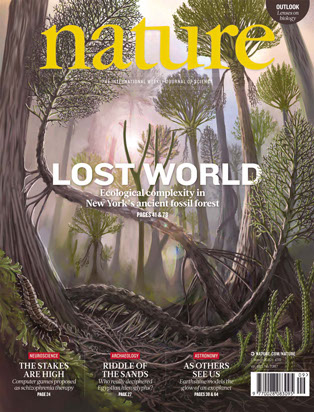
The illustrator Victor Leshyk was commissioned to create an illustration of this forest, which was to accompany a 2012 research paper by Berry and his colleagues in Nature, the world’s leading multidisciplinary science journal since 1869. It also was to appear on the cover of the journal and Berry features it in his talks as well.
The cover of Nature 483
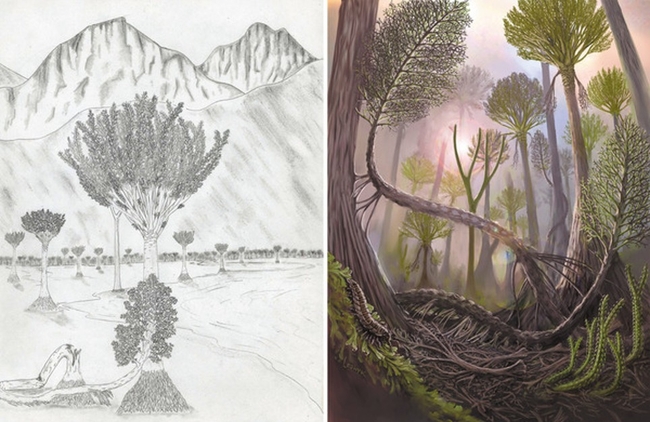
The digital oil painting titled ‘Lost Worlds’ was based on a sketch from researchers and made it possible for Berry to experience what the living forest might have looked like so many millennia ago.
Credit: Left: Frank Mannolini/New York State Museum. Right: Victor Leshyk
Furthermore Madhusoodanan also talks about other scientists in different fields and how their cooperation with illustrators turned out. There are many benefits for scientists working with illustrators:
Visually stunning images help raise the visibility of the scientist’s work and generate more online views
Papers including scientific illustration are more likely to be shared digitally or written about
They attract more students to a lab
They attract a wider audience than non-illustrated papers
Researchers are able to show a better the public-outreach, when applying for grants or funding
Working with the illustrator can reveal gaps in knowledge and inspire new experiments
Stein, W., Berry, C., Hernick, L. et al. Surprisingly complex community discovered in the mid-Devonian fossil forest at Gilboa. Nature 483, 78–81 (2012). https://doi.org/10.1038/nature10819
We are now experiencing hard times, the music industry is suffering a lot of damage and, due to the pandemic, all concerts have been cancelled. Thanks to the internet there are some solutions we can adapt to survive those times, obviously it is not something that can 100% satisfy this loss, yet it is something that can help us.
One of these is live-streaming performances. Bands can use this moment to promote themselves better on the web and, even if it is not possible to play live, organizing a good live-streaming could be an important step in the development of the band itself.
This can only work if it is done well, taking all precautions and using the right equipment.
But what exactly is live-streaming? Well, it is a method of broadcasting audio and video over the internet. This allows viewers to tune in from different devices (phone, computer, TV). This medium allows you to reach more fans than ever, and is also immediate, there is no need to record/edit/print/distribute materials.
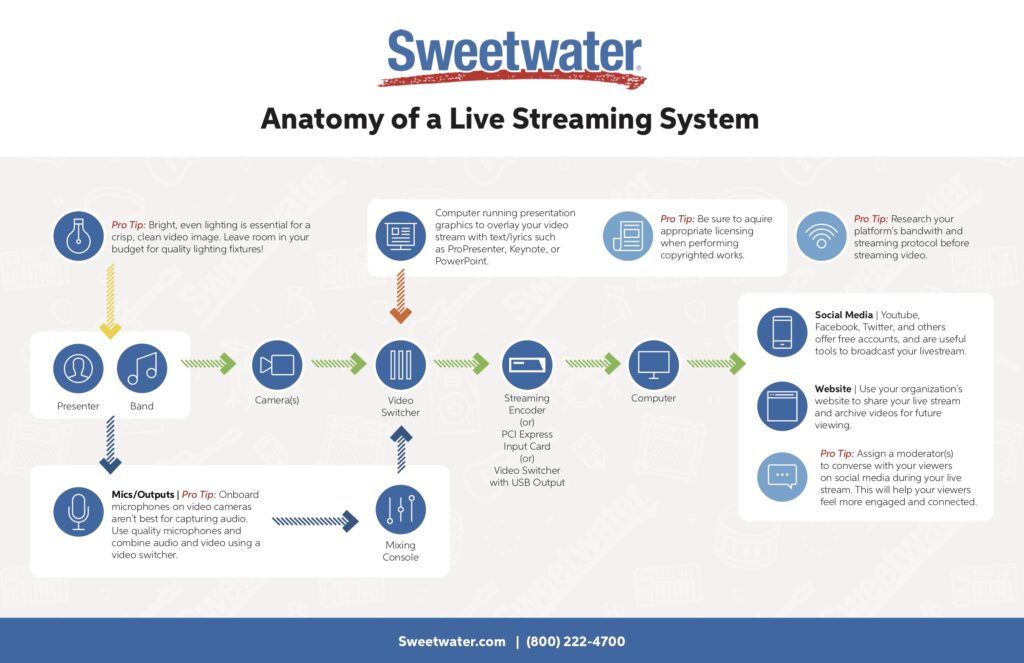
What do you need?
Live-streaming can be as simple as hooking up a single camera to your computer, or it can be an elaborate process requiring a considerable amount of specialty equipment. When it comes to the video, an essential setup consist of two or three cameras, a video mixer, a reliable computer, and a live-streaming service that fits your needs.
But remember, nothing makes good video more intolerable than poor audio. The right microphones positioned correctly can make all the difference in the world. There are two basic directions you can go with audio: taking an auxiliary feed from the mixing board or using an all-in-one video mixer.
Auxiliary Send
If you only stream the mix from the board, then your performance may not sound its best, why you only mike the quieter sources, such as vocals and keys through the PA, leaving drums and guitars out of the mix.
You need to set up a couple of room mics, but a far better solution is to set up more instrument mics and only send them to a dedicated auxiliary output that generates a mix tailored for your video stream.
All-in-one video mixer (the best solution)
They combine video cameras, video sources, and multichannel audio all into a single unit.
Video mixers such as the Roland models (https://www.sweetwater.com/c1005–Roland–Video_Mixers) also typically include USB connections specifically intended for streaming and recording.
–What to look for in a video mixer:
Number and type of video camera inputs
USB and additional video inputs for slide shows (lyrics) and other sources
USB for recording and streaming
Audio I/O for mixing and sound reinforcement
Additional video processing such as transitions and effects
Streaming Platforms
There are plenty of great options out there, and some of the more popular names in live-streaming include DaCast, Ustream, Livestream, and Wowza – all considered standards.
While there are free services, such as YouTube Live or Facebook, they won’t offer you as much control of your content as a commercial service. These services cost anywhere from $20 to $100 per month for entry-level service, with the average being around $50 per month.
These platforms actually vary quite a bit, some specializing in security while others offer more or less online storage.