The second type of signal correlation is the cross-correlation.
In this case, it is a measurement that tracks the data in a time-series of two or more signals relative to one another.
It is used to compare multiple time series and objectively determine how much resemblance exists between them and, in particular, at what point the best match occurs.
To be more precise, in signal processing, “cross-correlation is a measure of similarity of two series as a function of the displacement of one relative to the other.”
This type of correlation is also called sliding dot product or sliding inner-product.
It has various applications, such as in pattern recognition, single particle analysis, electron tomography, averaging, cryptanalysis, and neurophysiology.
A good way to find the cross-correlation is to use graphics.
It works like the autocorrelation, thus we have a reference signal, and a second signal is shifted sample by sample to the right at every interval, and every time those signal are firstly multiplied and, secondly, the result is summed.
Here is an example: [1]
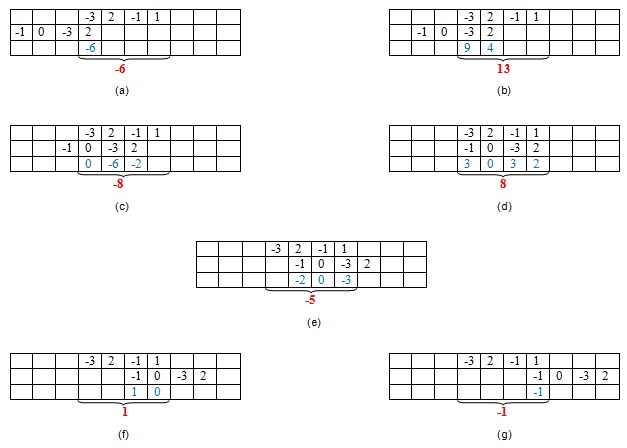
In the first line is represented our reference signal, in the second one the signal we want to compare with. As the samples are sliding frame by frame, the digital values of the signal are being multiplied, then their result is summed.
We got those values: -6, 13, -8, 8, -5, 1, -1.
8 is the zeroth sample, this means that the two signal are fully overlapped, no sample is left behind.
Yet, the highest peak is 13, when only the last two samples of the second signal is correlated with the first two of the reference signal. This is due to the fact that, in this case, the signals overlap at its best, as the samples of the two are identical.
References
[1] H.L. Sneha: Understanding Correlation. 2017
[2] Wikipedia – Cross Correlation.