What is it? Correlation normally describes the mutual relationship that exists between two or more things.
In statistics, it referred to any association which, considering a pair of variables, refers to which degree they are linearly related.
We could also say the same thing in the context of signals, where the correlation between signal indicates how much one signal resembles another.
There are 2 types of correlation in signal processing: autocorrelation and cross-correlation.
When the signal is correlated with itself, it’s called autocorrelation. In this case the signal is mostly compared with its time-shifted version.
One way of computing it is through the graphic technique.
Considering the first digital signal, already represented graphically, we then shift sample by sample the second signal at each interval, overlapping it with the first one. The results are continuous multiplication and addition.
This process is well represented in this image: [1]
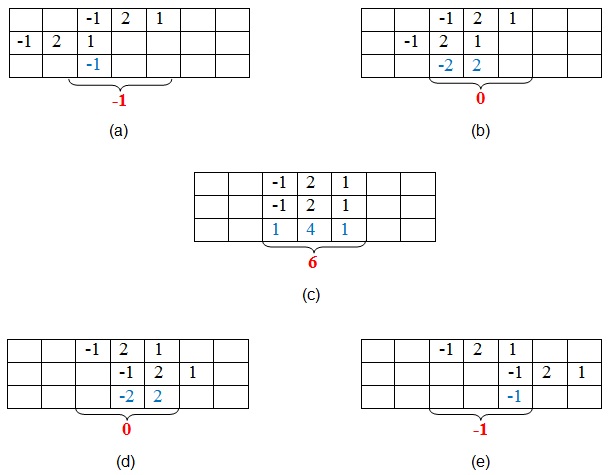
As we can easily imagine, the first row represents the given signal, our reference one. The second row represents its time-shifted version, compared sample by sample to the reference one. The third row is the result of the multiplication of the first two rows and the red number is their sum.
So, we got those results: -1, 0, 6, 0, -1.
The maximum value is obtained when the overlapping signal best matches the reference one, therefore, in this case, when the time-shift is exactly zero, as there will always be a peak at a lag of zero in an autocorrelation. Also, its size will be the energy of the signal.
References
[1] H.L. Sneha: Understanding Correlation. 2017
[2] Wikipedia – Correlation