Bandoneon! (A Combine)

Bandoneon! (A combine) is a work of the American pianist and experimental composer David Tudor. (“!” means “Factorial”).

This is his second work as a composer and his first full concert work, it was made for a 9 night special event in New York in October 1966 which included a number of various artistic expressions, such as avant-garde dance, music and theater. All with the collaboration of 10 artists (including John Cage) from New York and 30 engineers and scientists from the famous Bell Laboratories, an American industrial research and scientific development company (now owned by Nokia).

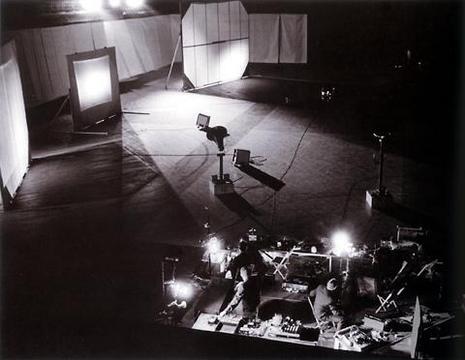
The location was in the 69th Regiment Armory, New York City, and titled “9 Evenings: Theater and Engineering”.

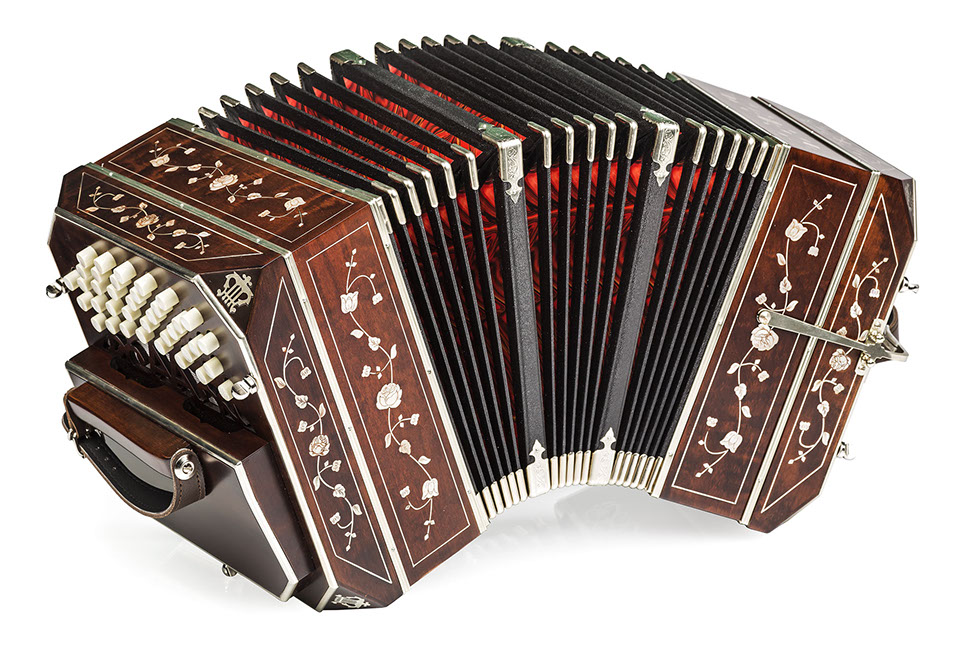
A Bandoneon (a musical instrument, whose origins are linked to Germany more than 150 years ago, but frequently used in Argentine Tango) was used as an input instrument.

This input was sent into a complex audio and visual modification system. This system was able to move the sound from speaker to speaker (12 in total) and at the same time control lights and video images that animated the entire location.

Luckily this performance was filmed, and a DVD was also released, although it’s not that easy to find.

Here is the diagram of the performance:

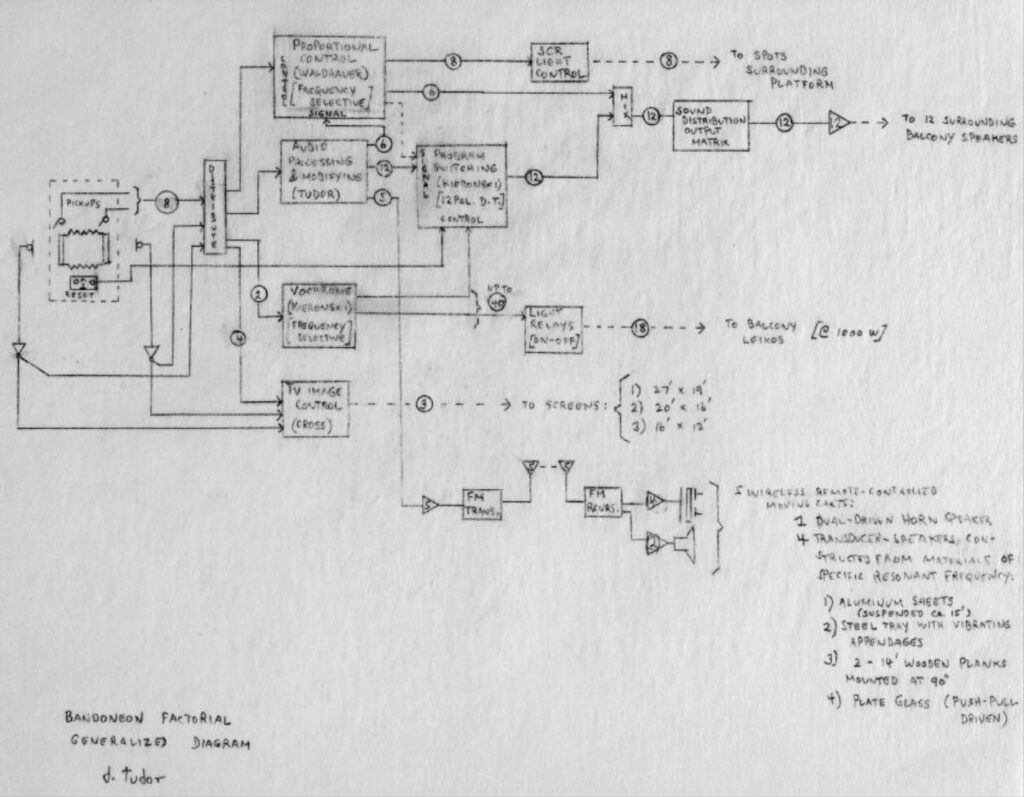
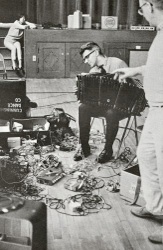
The audio signal is first sent to a single distributor, then transmitted to the Proportional Control System (instrument developed from Fred Waldhauer, used to control the intensity of the sound from 12 balcony loudspeaker surrounding the entire space, and to control the intensity of 8 spotlights surrounding the platform where he sat playing the Bandoneon),

[Proportional Control System]

Then to an electronic sound processor built by Tudor [Audio Processing & Modifying], then to the Vochrome (an instrument developed from Robert Kieronski, used to convert a continuous signal intro discrete triggers. It enabled the Bandoneon sound to control the switching of the balcony spotlights via light relays, and the switching of audio signals). 

(Vochrome)

And to the TV Image Control (Developed from Cross). 

The Proportional Control System modulates the intensity of light coming from lamps placed around the stage, while the projectors on the balcony are controlled by the Vochrome.

Another interesting thing about this work is that the acoustic space, through the Acoustical Feedback, was used as an oscillator.

Here an excerpt from the performance:

Resources

You Nakai – Reminded by the Instruments: David Tudor’s Music

Wikipedia – David Tudor

Wikipedia – Bandoneon

Clarisse Bardiot – 9 Evenings: Theatre and Engineering

Composer Inside Electronics – David Tudor exhibition

MedienKunstNetz – David Tudor >Bandoneón!<

Museo Nacional Centro de Arte Reina Sofia – 9 Evenings: Theatre & Engineering. Bandoneon! [Bandoneon Factorial] (A Combine)

Physical Modelling pt. 2

There are several reasons why we should use this technique instead of just playing real musical instruments.

For example, for people who build instruments, they could simulate various changes in an instrument (shape, material etc …), to already know how it would sound, without actually building it. This would reduce costs and production times.

Therefore, it is also possible to simulate something that is not possible in the real physical word, but it would lead to unique and interesting sounds!

Even just doing tests to see if our physical modeled instruments really sound like a physical (real) version is a great motivation to explore this topic. This also leads to a better understanding of the instrument itself.

This also opens up the possibility of playing instruments with slowly changing parameters. We could also do a real Morphing between instruments, not only in the studio, but also during a live performance. Obviously this will lose the realistic part of the instrument itself, but it could work perfectly for an experimental performance (and not only).

What exactly is modeled?

Real instruments are “broken down” into their components such as string, sounding board, tube, mouthpiece, hammer and so on, in order to model them all separately.

It is also important to add some non-linear components (such as diodes, transistors, inductors and iron core transformers), as most tools contain them, but they are really difficult to manage analytically. A bit of randomness is also a really important part, as if we had total control of all parameters, we would lose the reality of the instrument. (there is always a small percentage of randomness in the real word!)

This is the first commercial physical modelled synthesizer (1994), it calculates model of wood instruments:

Sample oder Physical Modelling?

Here are some other examples (VST):

Based on physically modeled acoustic resonators

Piano

Strings

Drums

References

Wikipedia – Physical Modelling

Physical Modelling – Seminar Klanganalyse und Synthese, TU-Berlin, 2001

Physical Modelling pt. 1

You may have heard this two words of it before, especially if you have already been confronted with some engineering project or some synthesizer.

But what is it about?

In summary, physical modeling is a way to model and simulate systems made up of real physical components. It is a simplified material representation, usually on a small scale, of an object or phenomenon, for analyzing it.

But why? This model can be used to simulate the physical conditions involved (temperature, speed, etc.) and to predict the particular constraints of the situation. These constraints can be considered and tested and solutions implemented before the final stages of a project.

It is used in various fields, for example in aeronautics, urban planning, construction but also for sound synthesis.

In the field of design, its main goal is to test aspects of a product against user requirements. Physical modeling not only allows designers to explore and test their ideas, but also to present them to others.

In the sound field, physical modeling seeks to recreate a musical instrument using a model and the laws of physics and to simulate its behavior. The algorithms are then simulated on a computer and the data stored or played as sound in real time.

We will go deeper into the theme of sound in the next part.

Resources


Futura-Science – Physical model

MathWorks – Physical Modeling

DesTechWiki – Modelling

Processing of action and non-action sounds

The human brain always amazes with every single research that is done about it.

Our perception of the whole word depends on how the information we receive is processed in it.

A study I recently read deals with an interesting aspect of how the sound of actions is processed in our brains.

Research on this topic began with the suggestion derived from neuropsychological researches that the brain does not process all sound events in the same way, but that it makes a distinction between the sound produced by one agent (actions) and all others.

The research started from the analysis of audiovisual mirrors in the brains of monkeys, and some more recent experiments on humans suggest the existence of two different brain mechanisms for sound processing.

Action-related sounds activate the mirror system (with, in addition, a motor action program, to represent how the sound was produced.) Non-action-related sounds do not.

In one experiment, Lahav [2] played some non-musicians to listen to a piece of piano music they had just learned and showed that their premotor areas of the brain were activated, whereas it wasn’t when they were listening to a piece they hadn’t learned.

This not only triggers a representation of how the sound was produced, but could also prepare a listener’s reaction.

 “Cognitive representations of sounds could be associated with action planning patterns, and sounds can also unconsciously trigger further reaction from the listener.” [1]

This mirror system is also activated when the action can be seen, so it could be interpreted as an abstract representation of the action in our brain.

Resources

[1] T. Hermann, A. Hunt, J.G. Neuhoff –  The Sonification Handbook

[2] A. Lahav, E. Saltzman, and G. Schlaug. – Action representation of sound: audiomotor recognition network while listening to newly acquired actions.

The genius of Trent Reznor

One of the most influential bands of our time are certainly the Americans Nine Inch Nails (NIN), founded by singer / composer / programmer / multi-instrumentalist / visionary / genius Trent Reznor in 1988.

Nine Inch Nails have sold over 20 million records and were nominated for 13 Grammys and won 2. Time magazine named Reznor one of its most influential people in 1997, while Spin magazine once described him as “The most vital artist in music”.

Their concerts are characterized by their extensive use of thematic visuals, complex special effects and elaborate lighting; songs are often rearranged to fit a given performance, and melodies or lyrics of songs that are not scheduled to play are sometimes assimilated into other songs.

Trent is also famous for soundtracks of him along with his bandmate Atticus Ross.

They (he) deconstructed the traditional rock song, a bit like Sonic Youth did, but they went in a more electronic and aggressive direction. Their music is characterized by their massive use of Industrial sounds (although, not as massive as for the berliners Einstürzende Neubaten) in early works and lately is focused on analog and modular synths.

The sound design work is a really important part in their composition, as important as the harmony and the melody. They probably used every electronic instruments (and software) they could find, turning them all into their signature, creating that industrial NIN sound. Reznor’s sound is always clearly identifiable. While some of that is due to his sound design, which includes digital distortion and processing noise from a wide variety of sound sources,

What I find really impressive, besides the sound design and beautiful dark lyrics, is the unique choice of harmony and melody progression.

Nothing is predictable and even in the simplest progression there is that note that takes you deep into Reznor’s mind, away from any other musical word.

Reznor’s music has a decidedly shy tone that sets the stage for his often obscure lyrics.

His use of harmony, chords and melody also has a huge impact on his sound. In the movie Sound City, Reznor explains that he has a foundation in music theory, especially in regard to the keyboard, and this subconsciously influences his writing of him:

“My grandma pushed me into piano.  I remember when I was 5, I started taking classical lessons.  I liked it, and I felt like I was good at it, and I knew in life that I was supposed to make music. I practiced long and hard and studied and learned how to play an instrument that provided me a foundation where I can base everything I think of in terms of where it sits on the piano… I like having that foundation in there.  That’s a very un-punk rock thing to say. Understanding an instrument, and thinking about it, and learning that skill has been invaluable to me.”

Here are some example of his writing process:

  • Right where it belongs

Here’s is a continuous shifting between D major e D minor, that marks also an emotional shift of feeling, going constantly from sad to happy and viceversa. This helps give the song its emotional vibe.

  • Closer

Here the melodic line ascends the notes E, F,  G, and Ab.  The last note is intentionally ‘out of key’ to give an unique sound sound.

  • March of the Pigs

The harmonic and melodic choices of this song are simply impressive. They are exactly what an experienced musician would NEVER do, yet they work great.

The progression is unusual because the second chord is a Triton away from the first chord (this means, something really dissonant, that sound you would always try to avoid). The melody is brilliant. The song is (mostly) in the key of D minor (these are the notes of the D minor chord, D – F – A), but in the vocal line it sings an F #. Also, sing the major in a minor key, the worst thing to do, and yet it sounds great.

I must say that falling in love with their music helped to “color outside the borders”. It is a wonderful feeling to know how things should be and to consciously destroy those rules to follow the pure essence of your art.

For anyone interested in learning more about chord theory, here is the full article I was inspired by:

https://reverbmachine.com/blog/trent-reznor-chord-theory/

Wanding

Wanding is a very important process for the OptiTrack system calibration.

A calibration wall is used, which is repeatedly shaken in front of the cameras so that all cameras can see the markers.

The CalibrationWand must be brought into the capture volume and carefully shaken through the entire aspiration volume. To collect samples with different orientations, it is best to draw figures of eight.

For adequate sampling, we need to cover as much space as possible and cover both low and high heights.

The wanding trails are shown in color in the 2D view. A table with the status of the measurement process is displayed in the calibration area to monitor the progress.

After enough samples have been collected, the software can calculate. Generally 2,000 to 5,000 samples are sufficient.

When done, the cameras are displayed in Motive’s 3D viewer. However, the recording volume built into the software still has to be aligned with the coordinate plane. This is because the ground plane is not fixed.

The final step necessary to complete the calibration is to set the ground plane and origin by placing the calibration square in the volume and indicating on the subject where the calibration square is located. This needs to be positioned within the volume where we want to place the origin and level the ground floor.

To set the coordinate system, reference is made to the position and orientation of the calibration square, so it must be aligned in such a way that it relates to the desired axis orientation.

Drums recording in When The Levee Breaks

Today we talk about Led Zeppelin, or rather “The Hammer of the Gods“, and their song When the Levee Breaks, included in their fourth masterpiece “Led Zeppelin IV”.

They are certainly one of the most important bands in the history of music, their innovative sounds and their incredible talent have been the key to their incredible success and the impact they have had on the world of music is not quantifiable.

Another hallmark of the (best) band is the visionary mindset of their guitarist Jimmy Page, not only as a musician, but also as a sound engineer.

In December 1970 the recording session of some parts of the album (Black Dog, Four Sticks) and, above all, When The Levee Breaks took place in Headley Grange (Hampshire, England), a poorhouse of 1790 transformed into a residence a la late 1800.

After the first few songs they got a new drum set and told the delivery guys to leave it in the huge hallway.

Then the drummer, John Bonham, came out to test the kit. Jimmy Page’s reaction was amazing, he was so amazed by the sound he had in the hall that he literally said “Let’s not take the drums out of here!”.

The production of the album was done with Andy Johns, he and Page experimented a lot on how to get that huge drum sound in a recording.

The solution? They hung the microphones (Beyerdynamic M160) on the second floor, at the top of a stairwell in Headley Grange, and the drums at the bottom.

Heavy amounts of compression have been added to the microphones to add excitement to the room.

Another curious fact, the drummer has made some changes to the drums, so they didn’t have to mic the kick!

Combined with John Bonham’s powerful and unique sound, the result was amazing. Something no one has ever done before.

This move continued Page’s philosophy of ambient miking for drums, rather than putting mics directly on instruments. According to him, the drums must breathe.

Here you can enjoy this Meisterwerk:

How I use the cross-correlation in Pd

First, I need to register a stream of data in an array. For example, data from the X-axis of a rigid body (in OptiTrack, motion capture system) for 10 seconds.

Then it is necessary to save the data of this array in a text file so that this data can be read out each time the patch is started and rearranged in the array. In this way the specific movement, or better our reference movement, is saved and automatically loaded into the patch every time.

The next step is to create a RingBuffer, a buffer that continuously records the product data. This must be at least as large as the data set that we want to recognize.

The RingBuffer Slider can look into the past so that it can correlate everything with the reference signal.

For example, I set the data resampling to a rate of 8.333 milliseconds, since the data I’m usicing are coming from OptiTrack, and they reach a maximum of 120 fps. This means 1000/120 = 8.333.

This is the interval between one sample and another.

Another index reads both arrays at the same time, which are first multiplied and then their results are added.

The final result indicates the degree of correlation, the higher this number, the higher the correlation.

In this way, we can set a threshold to establish the minimum acceptable level of correlation, so that we can decide how similar the 2 data streams have to be to generate an output.

One problem that could arise is the continuous output trigger when this value is set too low.

This can be solved, however, by setting a delay that defines the time after which this trigger can be shifted, or by triggering a number immediately after starting the loops in order to set the threshold value to a very high value, which with Cross-correlation is unattainable.

It should be noted, however, that comparing more data streams to have a more precise correlation (for example X, Y and Z axes) can cause computational problems for the computer as a large data flow is continuously examined and compared.

OSC and Pure Data

Pure Data (Pd) is a data flow programming language, which means that functions (objects) are linked (patched) in a graphical environment. This models the flow of controls and audio.
For example, for a project I use the Motive software from OptiTrack on the computer in the experimental studio and as soon as I open the BatBat application and connect the network cable to my MacBook, I can receive the data in real time so that I can use it on my PureData patch that runs on mine Laptop.

The client application that I use, BatBat, is being made for the communication with a OSX system and I would say It’s pretty funny, because the first time NEVER work, so you have to close it and restart. It’s like that every single session!

After the correct connections have been made, the objects must be added in Pd that can receive this data and make it usable.

The first object in the chain is “netreceive”, which enables the reception of a data stream coming from a specific port, specifying the desired data type, in this case UDP (“datagram”) and the desired encoding type, in this case binary numbers.

The other objects in the chain are used to take the numeric list and interpret them as bytes, producing an output with Pd messages and then set up the route to use the OSC data with certain messages. In other words, to use the data from exactly the desired source.

The last step that is necessary in order to use this data is to unzip this data. The letter “f” post as an argument of the object indicates the production of a FloatNumber as output. There are 3 in which they correspond to the data on the X, Y and Z axes.

Now we are ready to use those data to control our parameters in Pd.

Cross-correlation

The second type of signal correlation is the cross-correlation.

In this case, it is a measurement that tracks the data in a time-series of two or more signals relative to one another.

It is used to compare multiple time series and objectively determine how much resemblance exists between them and, in particular, at what point the best match occurs.

To be more precise, in signal processing, “cross-correlation is a measure of similarity of two series as a function of the displacement of one relative to the other.”

This type of correlation is also called sliding dot product or sliding inner-product.

It has various applications, such as in pattern recognition, single particle analysis, electron tomography, averaging, cryptanalysis, and neurophysiology.

A good way to find the cross-correlation is to use graphics.

It works like the autocorrelation, thus we have a reference signal, and a second signal is shifted sample by sample to the right at every interval, and every time those signal are firstly multiplied and, secondly, the result is summed.

Here is an example: [1]

In the first line is represented our reference signal, in the second one the signal we want to compare with. As the samples are sliding frame by frame, the digital values of the signal are being multiplied, then their result is summed.

We got those values: -6, 13, -8, 8, -5, 1, -1.

8 is the zeroth sample, this means that the two signal are fully overlapped, no sample is left behind.

Yet, the highest peak is 13, when only the last two samples of the second signal is correlated with the first two of the reference signal. This is due to the fact that, in this case, the signals overlap at its best, as the samples of the two are identical.

References

[1] H.L. Sneha: Understanding Correlation. 2017

[2] Wikipedia – Cross Correlation.