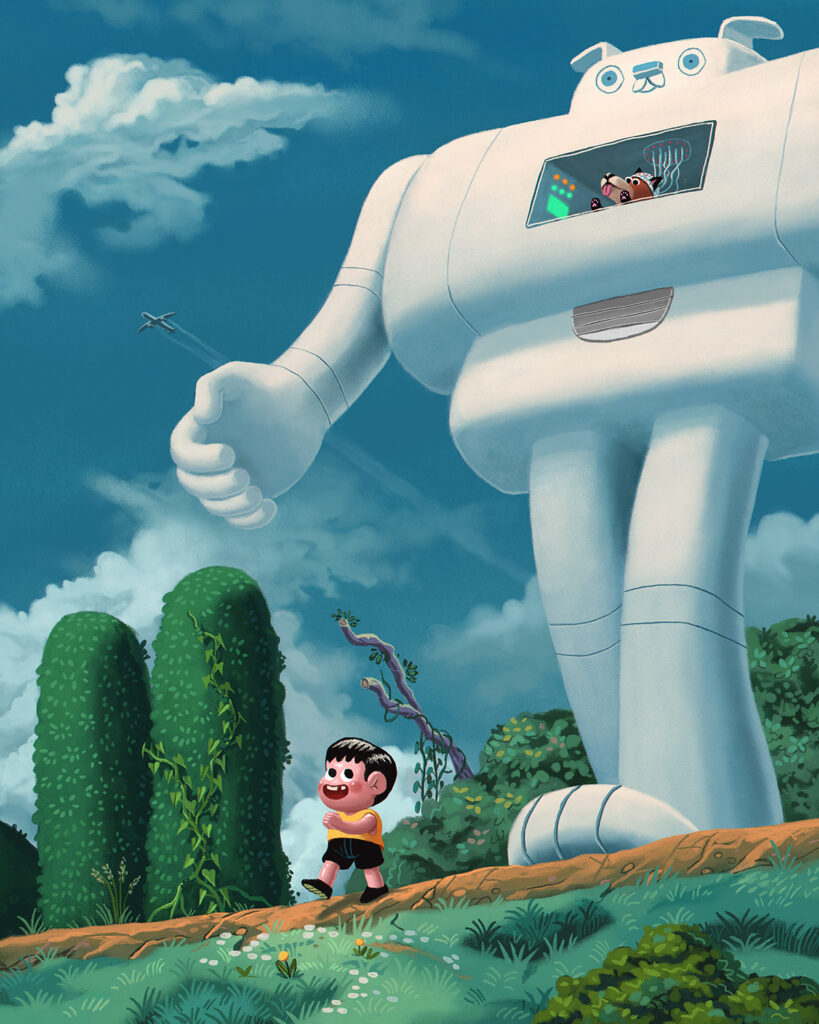
Daniel Shaffer (@danielhshaffer) is a freelance illustrator based in Atlanta, Georgia. His work in featured in many known magazines/papers like The New York Times, The Washington Post or Variety Magazine and his clients also include Cartoon Network, Samsung Publishing and many more.
I like his art mainly because it’s a bit weird (in the best way). Looking at his work is always fun and it makes me feel like not all art needs to be perfectly crafted and has to make sense. Seeing someone succeed which creating things they love without restricting themselves is refreshing. It gives me the courage to think about drawing shapes and characters that many people would label as strange without feeling ashamed of my desire to create something that just feels fun to create. Daniel Shaffer seems like he’s enjoying his job a lot and I strive to do the same.
While looking at different artists/illustrators I realized that me liking their work has no connection to the fact if they create their work digitally, analog or with a mix of both. I find all three approaches equally fascinating, but might be personally leaning towards the mixed/digital approach with analog textures.
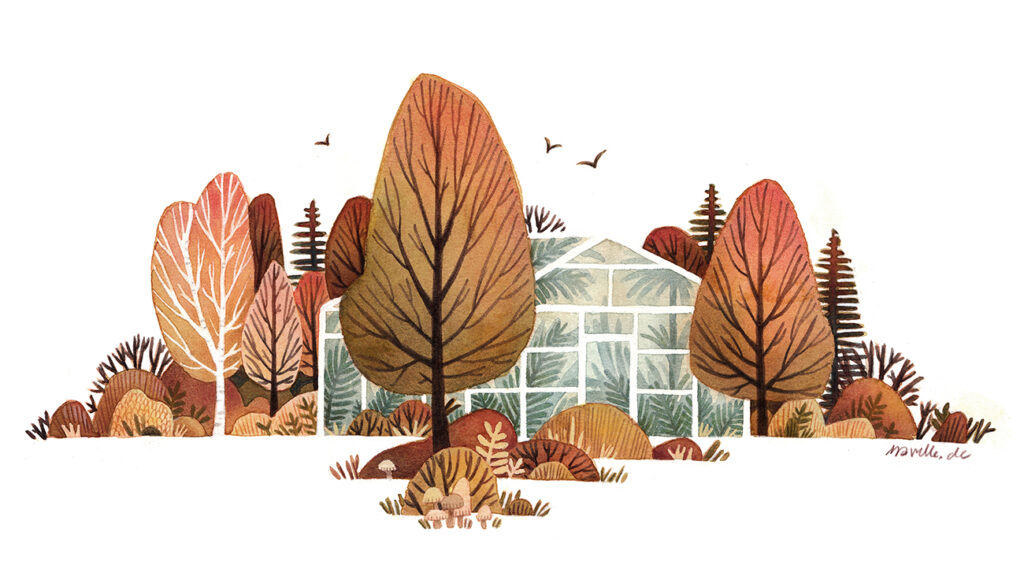
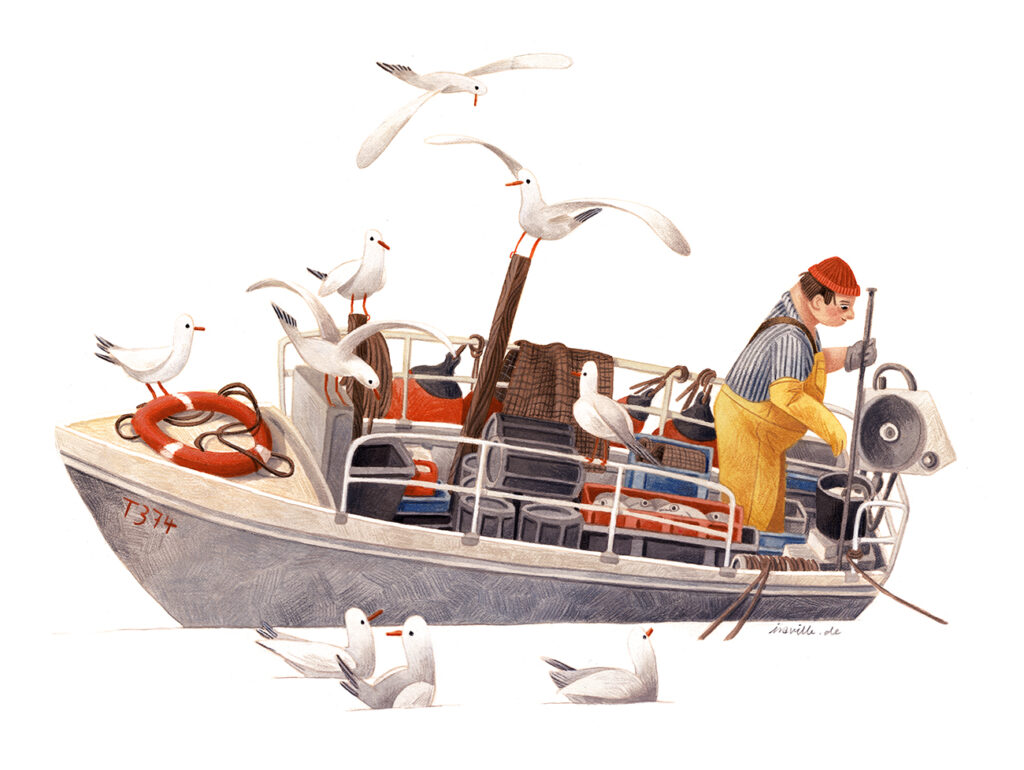
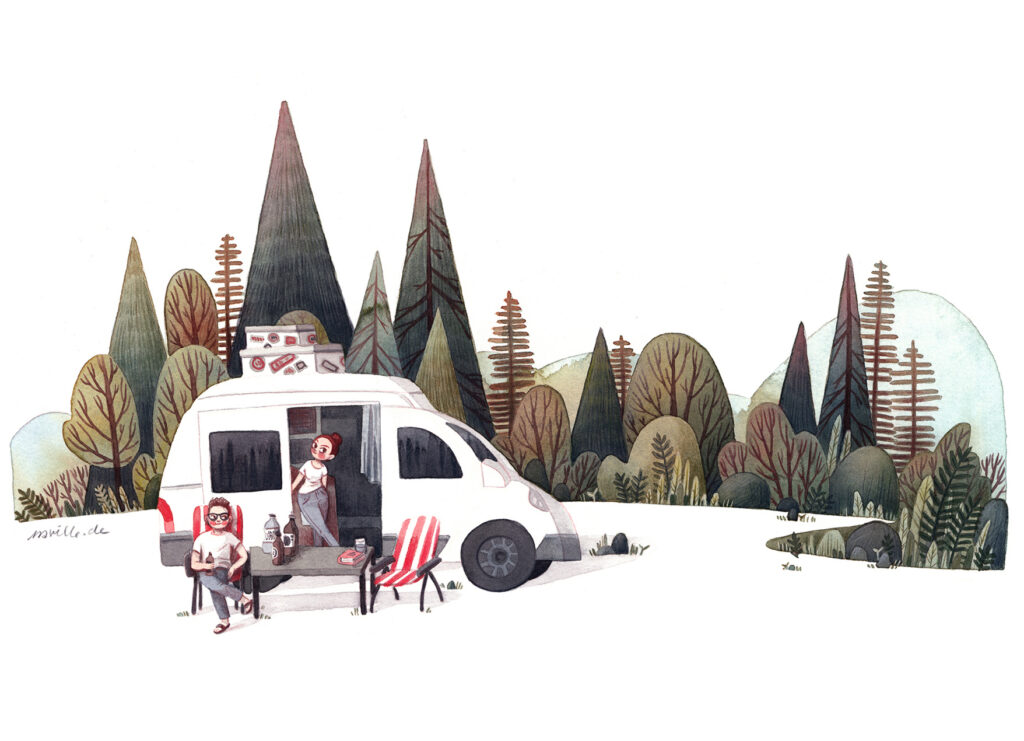
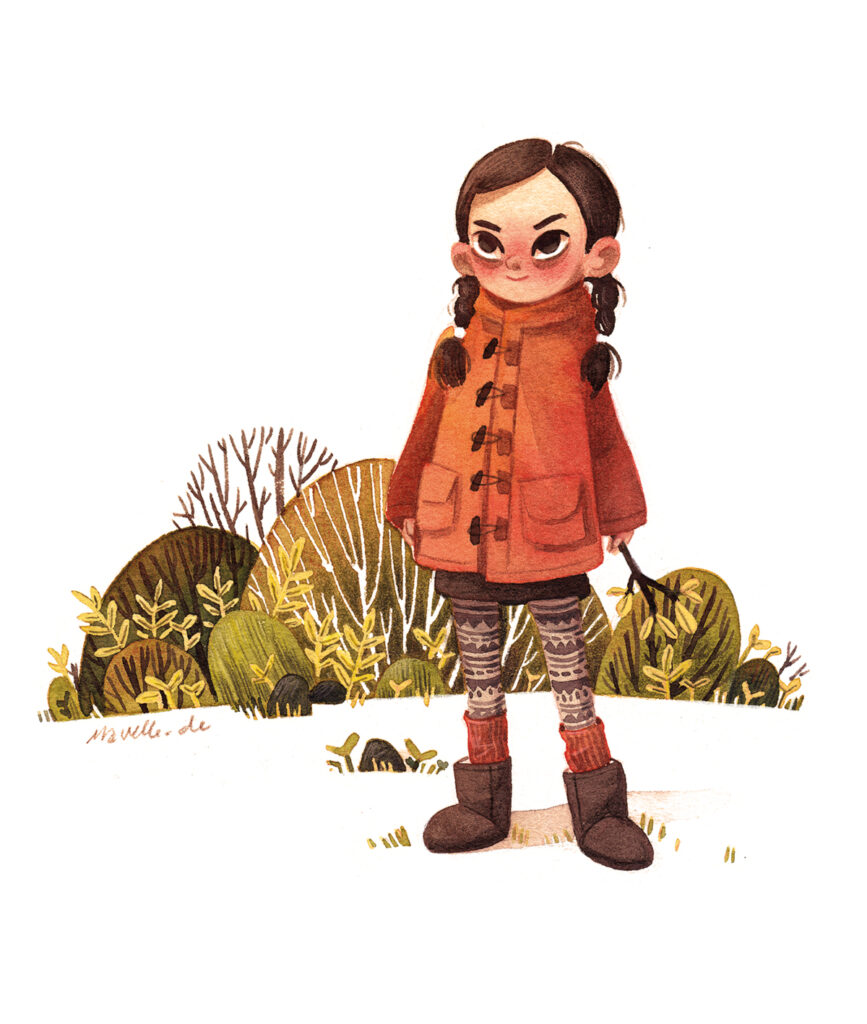
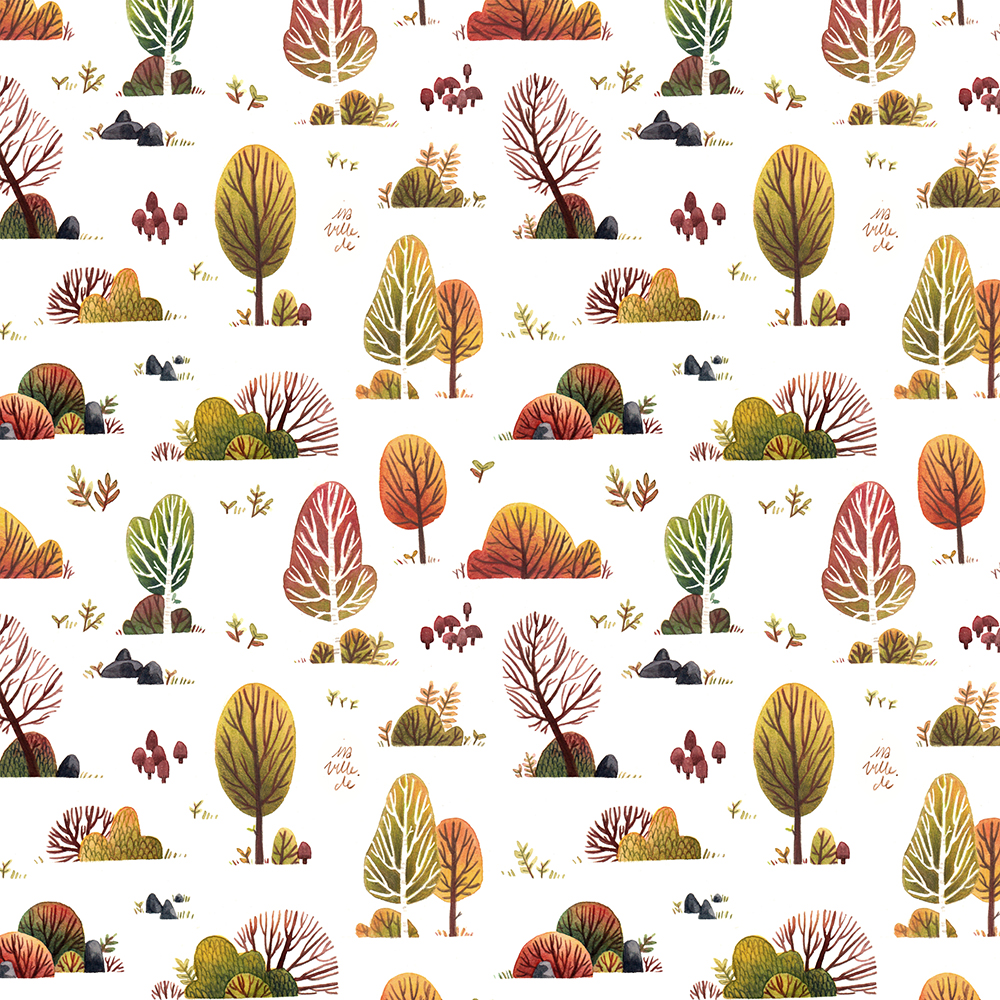
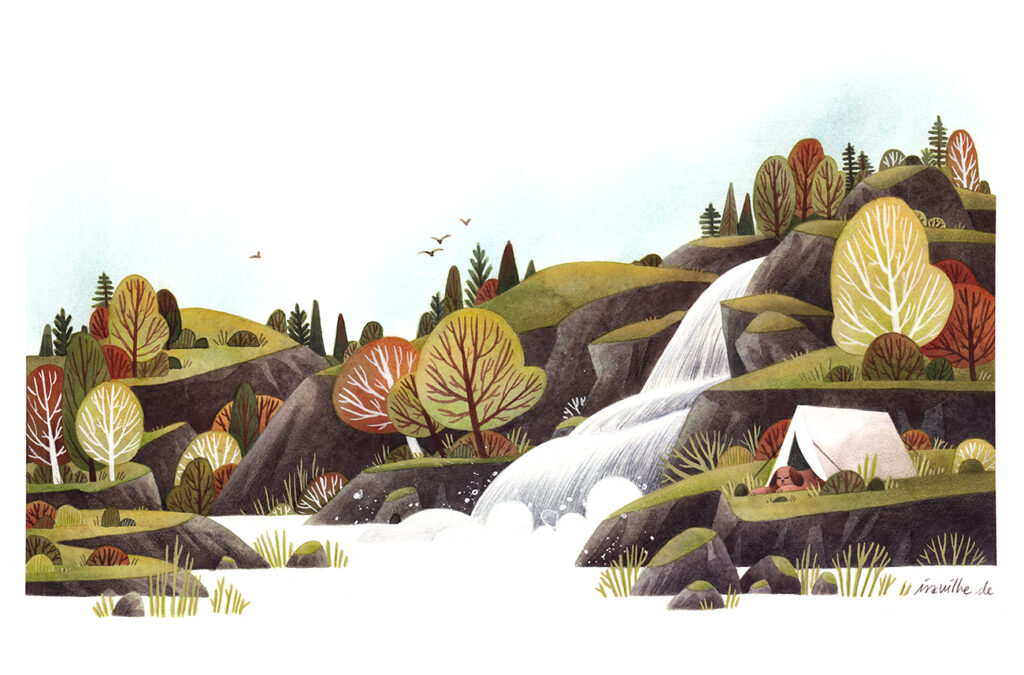
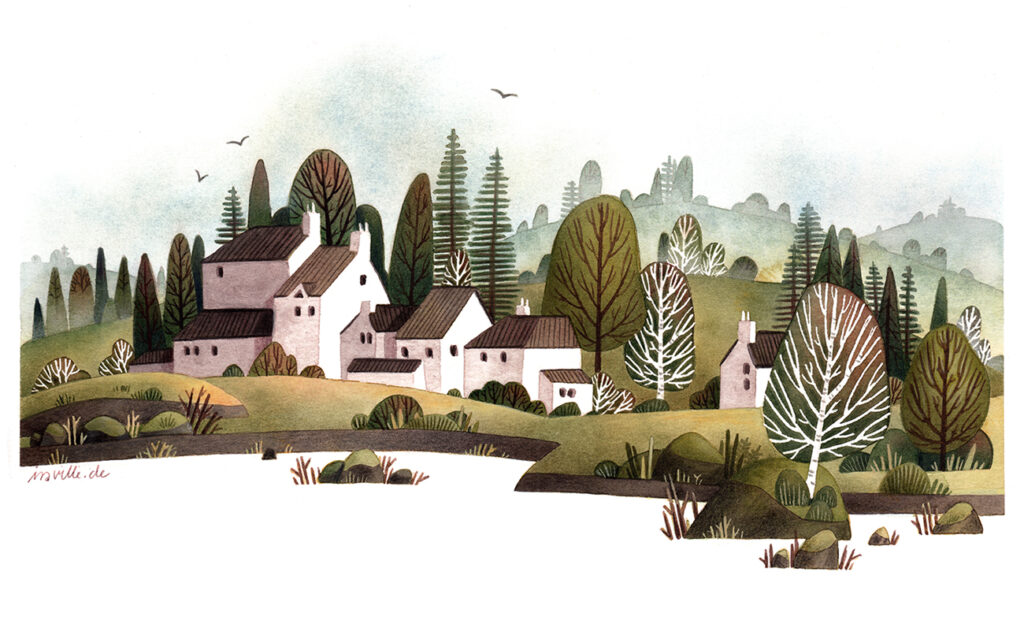
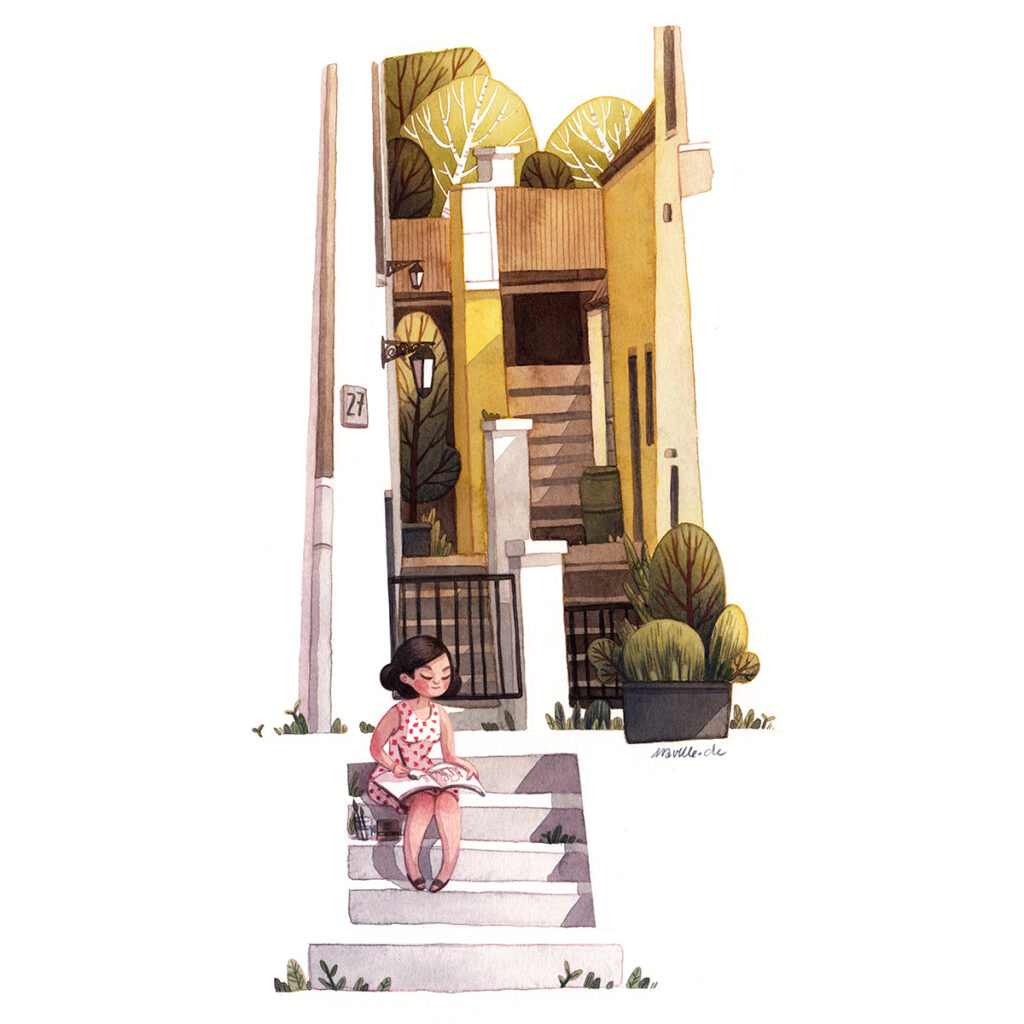
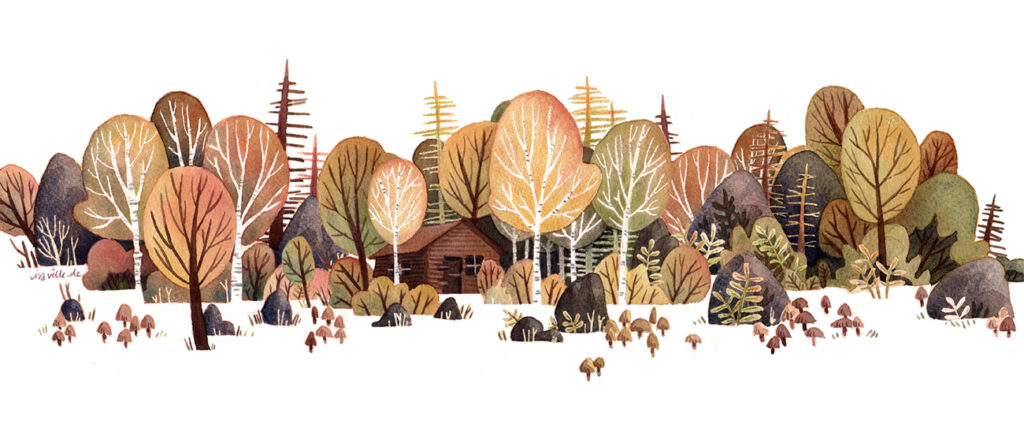
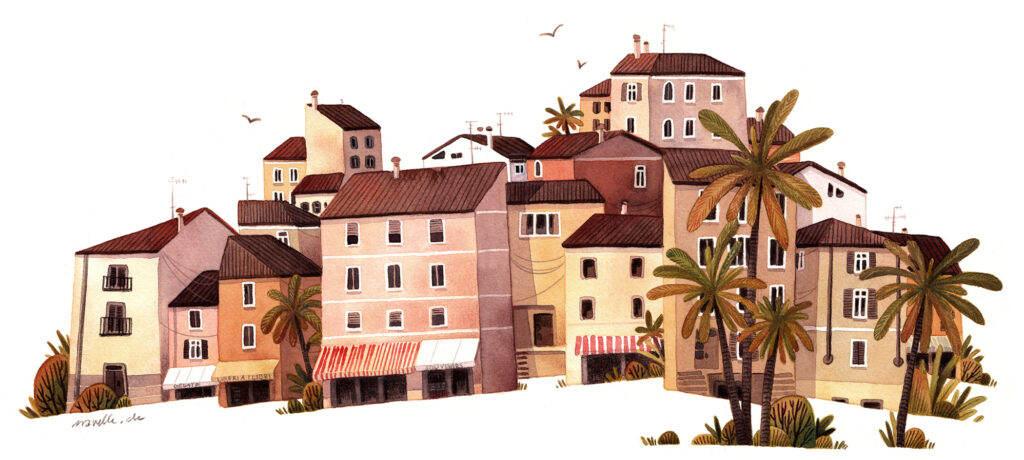
Ira Sluyterman van Langeweyde (@iraville) is an illustrator based in Munich with a passion for paper and watercolor. Most of her work is based around nature and landscapes but it also includes some character design. For her work she mostly uses earthy and natural colors. She mostly uses a white background and incorporates the white space into her compositions.
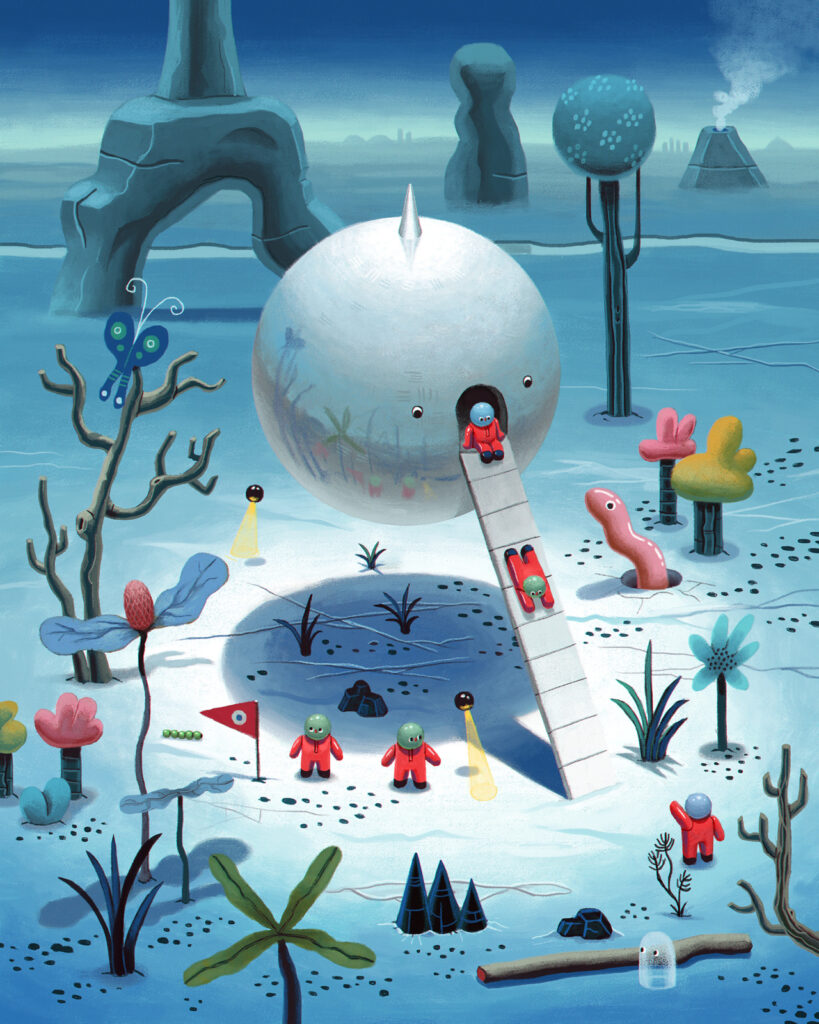
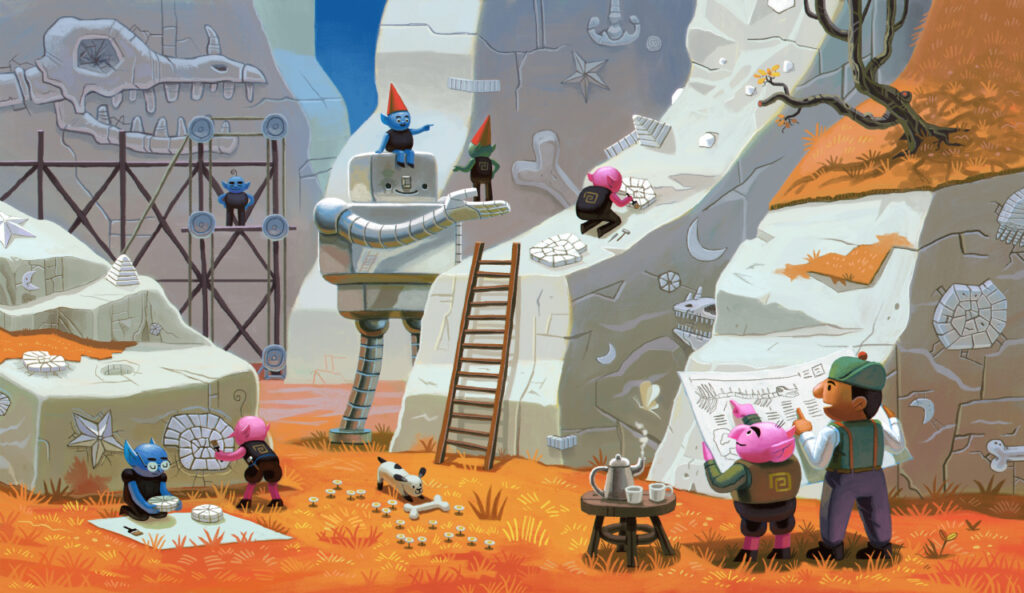
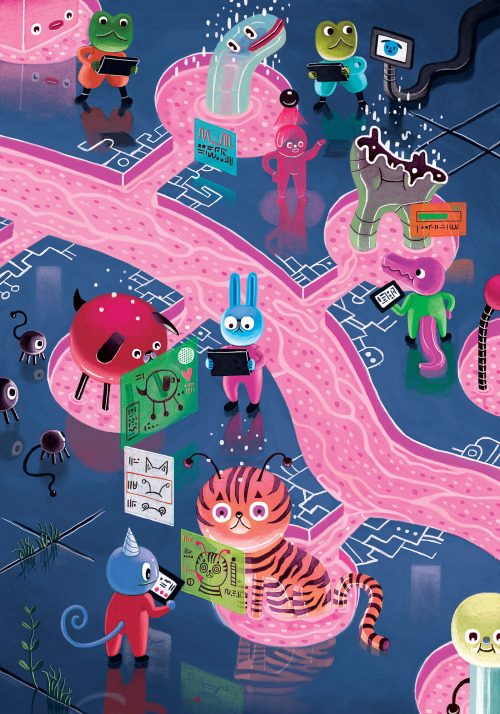
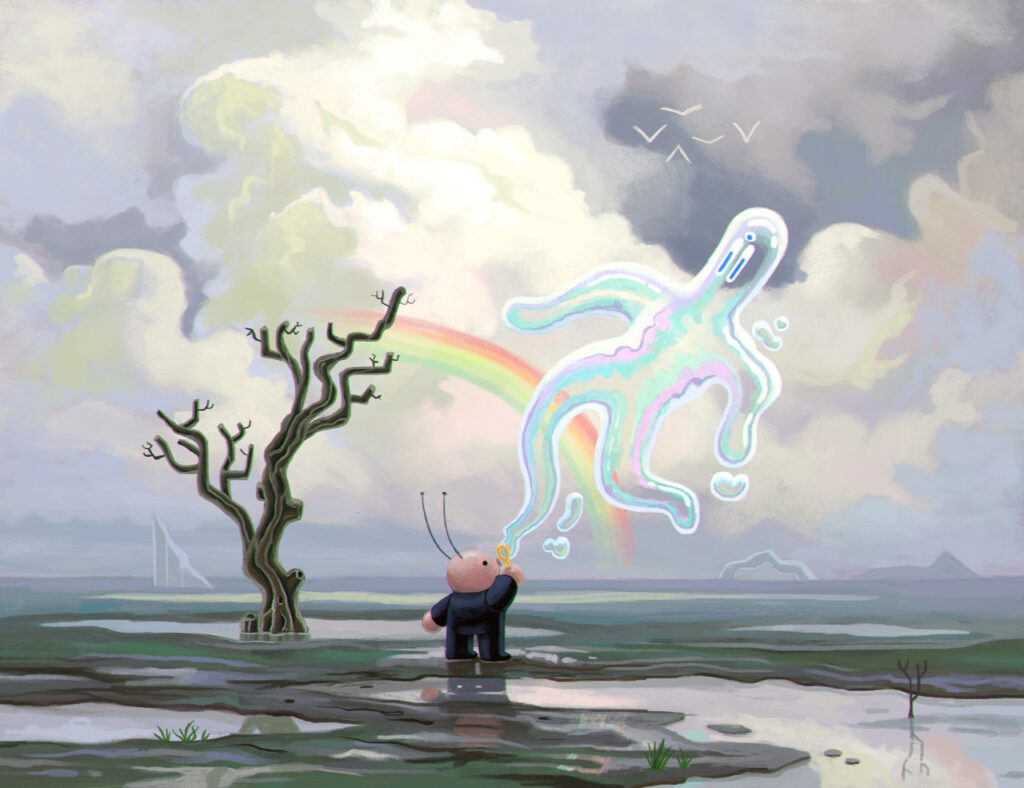
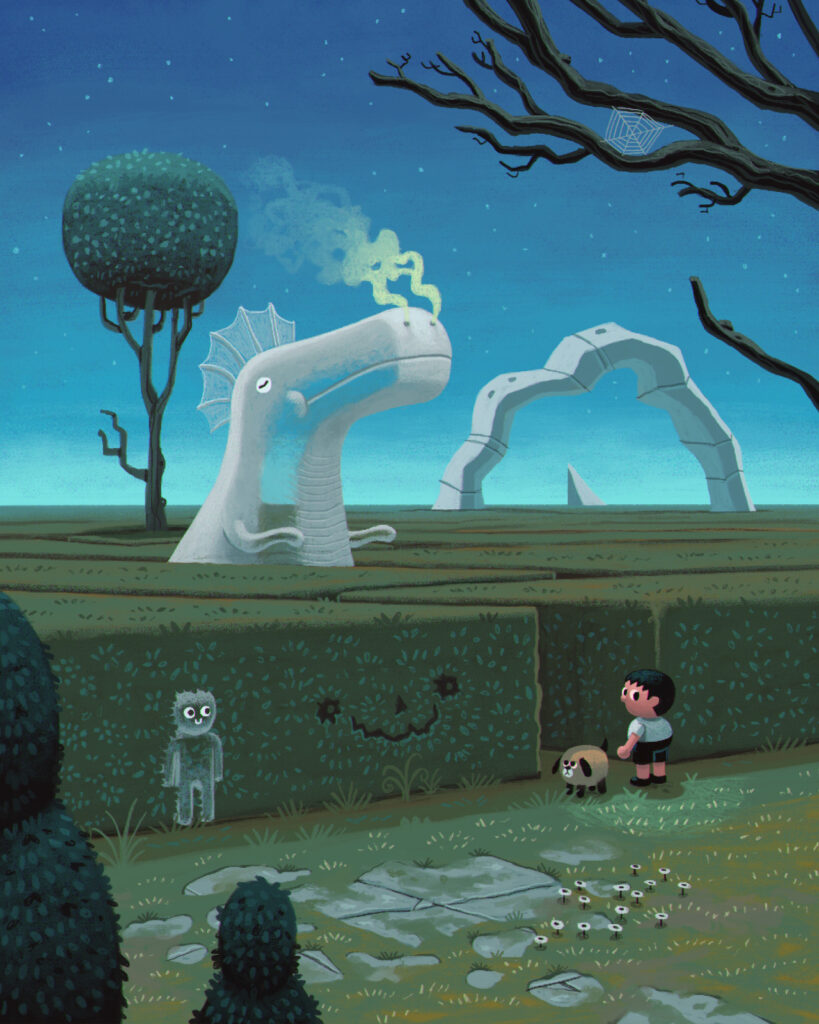
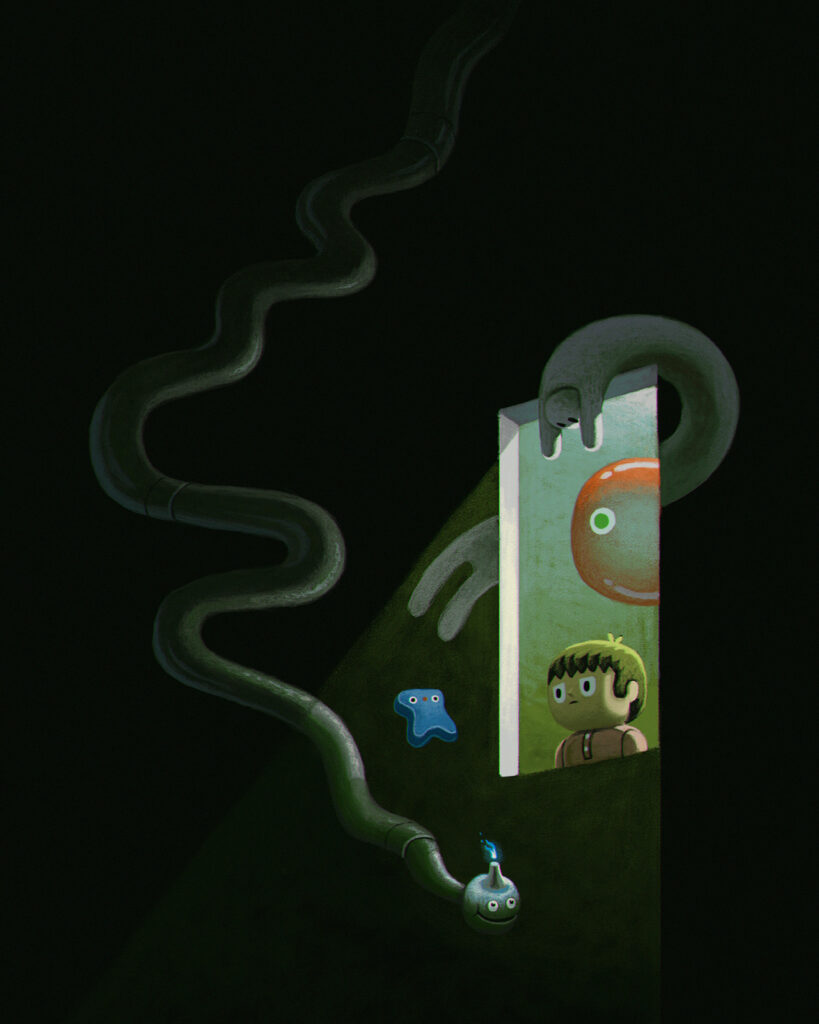
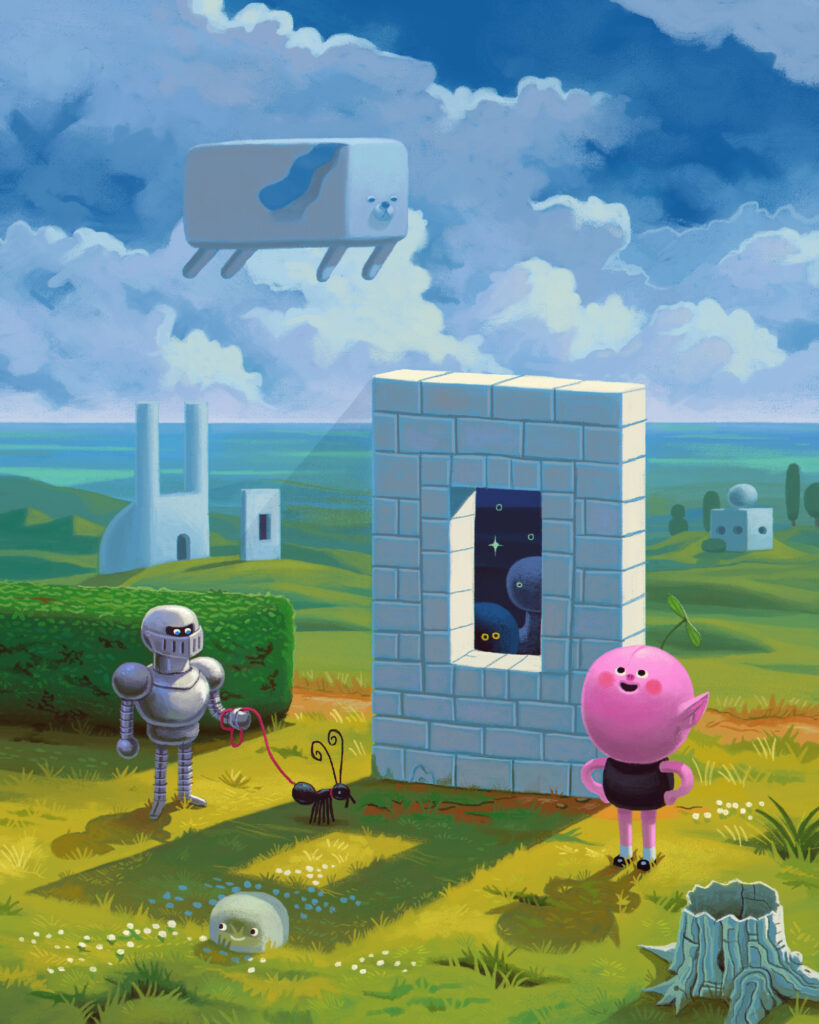
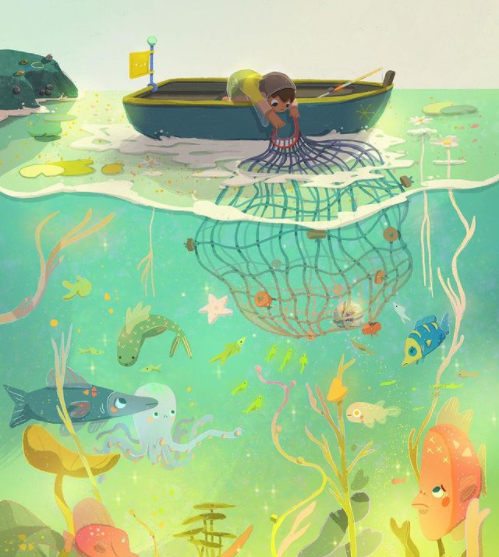
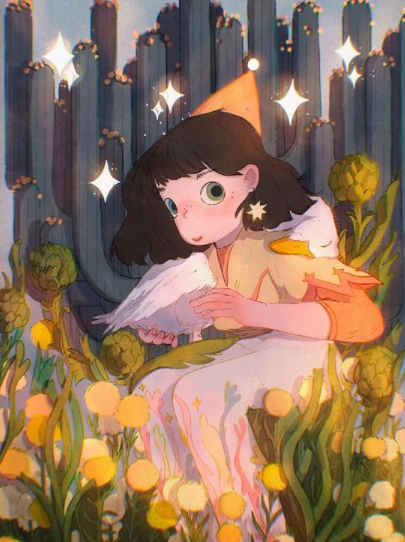
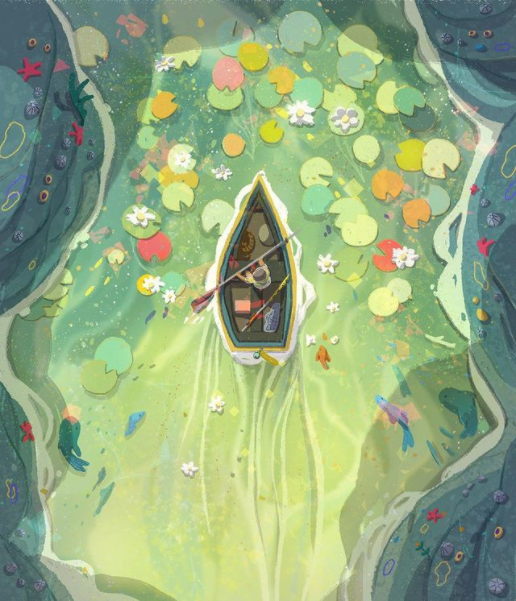
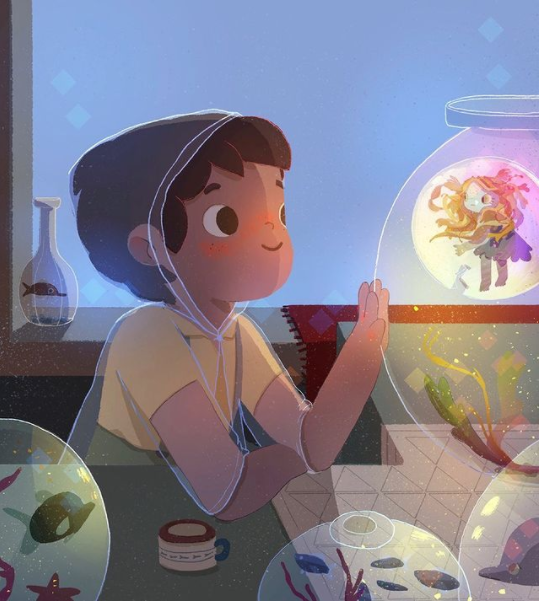
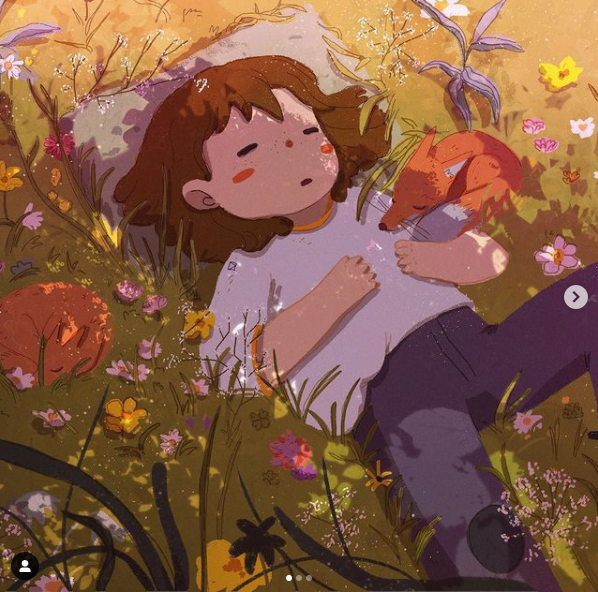
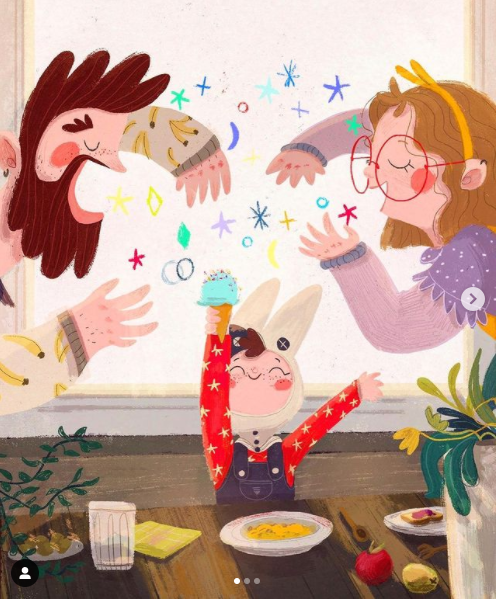
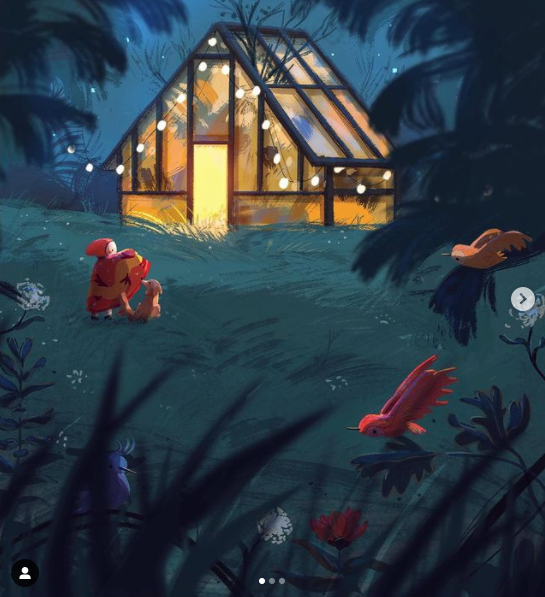
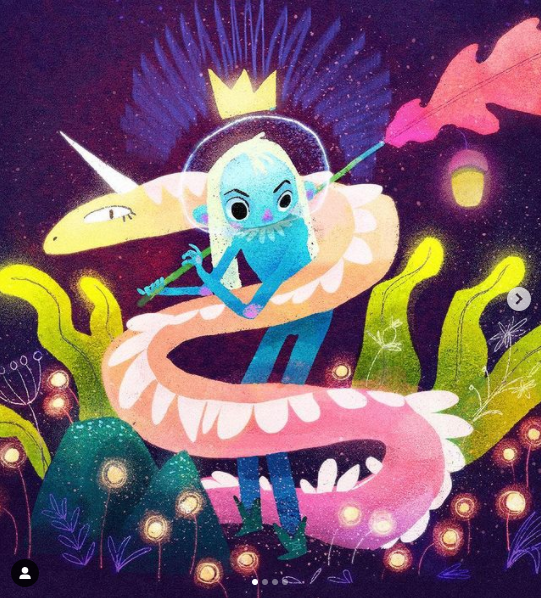
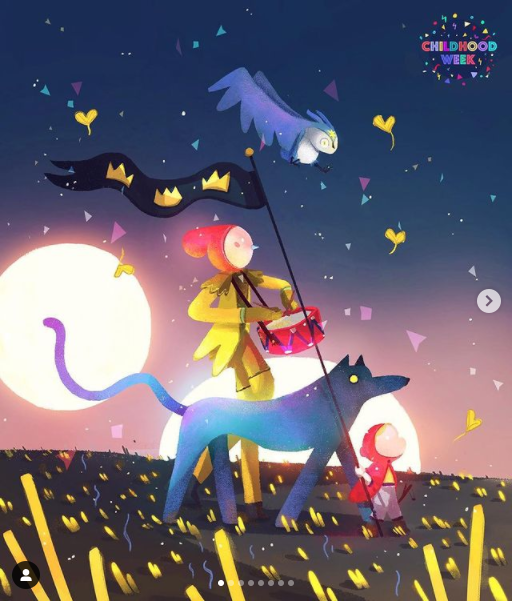
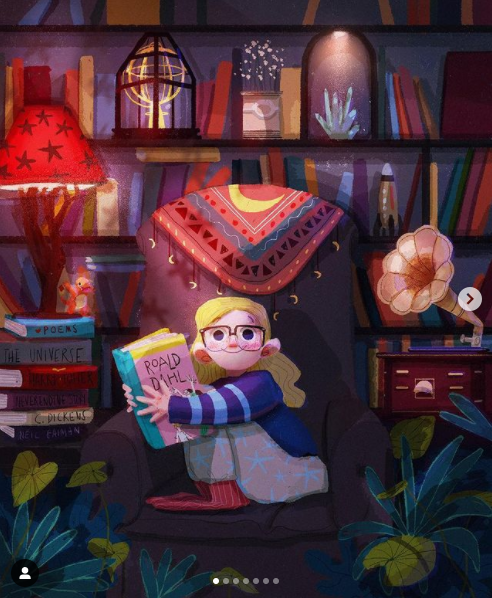
Here I go again, trying to figure out what I like and why. Today’s illustrator is Beatrice Blue (@beatrice.blue) an Art Director and author/illustrator working both on publishing and the animation industry. Her work is very playful and colorful. What draws me to her work is her use of different analog textures in a digital setting. I like her the color palettes she chooses, they harmonize with her painting style and motifs. The illustrations she creates feel soft and comforting, but also very playful.
I think the biggest reason why I like someones work is if it triggers some sort of emotional reaction whether it’s curiosity, happiness, longing or a feeling of understanding. The work of Beatrice Blue definitely invokes happy emotions.
Why storytelling is more trustworthy than presenting data Karen Eber | TEDxPurdueU
For Karen Eber telling stories is helping people feel seen and a great way to connect with people. Eber starts off her talk by explaining the neurological process when listening to a story or data and how through listening to stories you gain empathy for the storyteller. She clarifies that data doesn’t change behavior, emotions do and that data never speaks for itself. It needs context.
According to Eber a great story answers three questions: What is the context? What is the conflict? What is the outcome? It also builds and releases tension, creates an idea and helps you see new things as well as communicates value. To connect your story and data you want to share you have to come up with the framework for your data and story first. By retelling stories and talking about her own experience in consulting others Eber makes you think about presenting data in a whole new way.
Don’t wait for the perfect story. Take your stories and make it perfect.
Making data mean more through storytelling Ted talk by Data Scientist Ben Wellington @ TEDxBroadway
In his talk Ben Wellington tells the story of how he started doing data visualization of New York City. In 2011 a free public database called NYC Open Data was created. Using this data Evans created his first visualization about traffic accidents involving bikes, pinpointing hotspots in the city. After it got picked up by multiple online news sites, he realized that the closer you are to the data the more you care about it. You have to connect with peopleand their experiences and make it relatable. So the next data he visualized were which pharmacies cover which areas in the city, the percentage of male and female city bike riders as well as the percentage of parking tickets on cars with out-of-state plates. In his work he tried to focus on one idea, keep it simple and explore the things you know best to tell the most effective story. With data storytelling you should try and make an impact. Wellington does this by trying to impact city government and shows some of the best responses in his presentation.
Turning Bad Charts into Compelling Data Stories Ted talk by Data Storytelling Trainer Dominic Bohan @ TEDxYouth@Singapore
Dominic Bohan is a data storytelling trainer talking about charts, studies, history and how to turn data into stories. He believes that data storytelling can save the world and even save lives.
Data is useless unless human beings can interpret, analyse and understand it.
During his talk Bohan describes three simple principles to great data communication: Using a human friendly chart type, being ruthlessly minimalistic and having a clear key takeaway.
To dive into these principles Bohan describes an 1984 study by researchers Cleveland and McGill on which charts humans are good at interpreting. According to him, they found out that human beings are best at encoding numbers by length and position. By talking about history approaches, studies and their outcome as well as giving examples and using the recommended charts, Bohan shows how (not) to use data visualisation and how to utilize them to tell engaging stories that mean something to us.
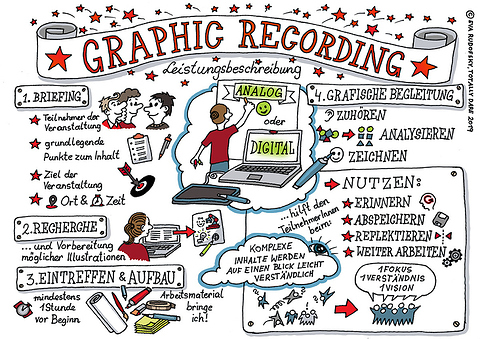
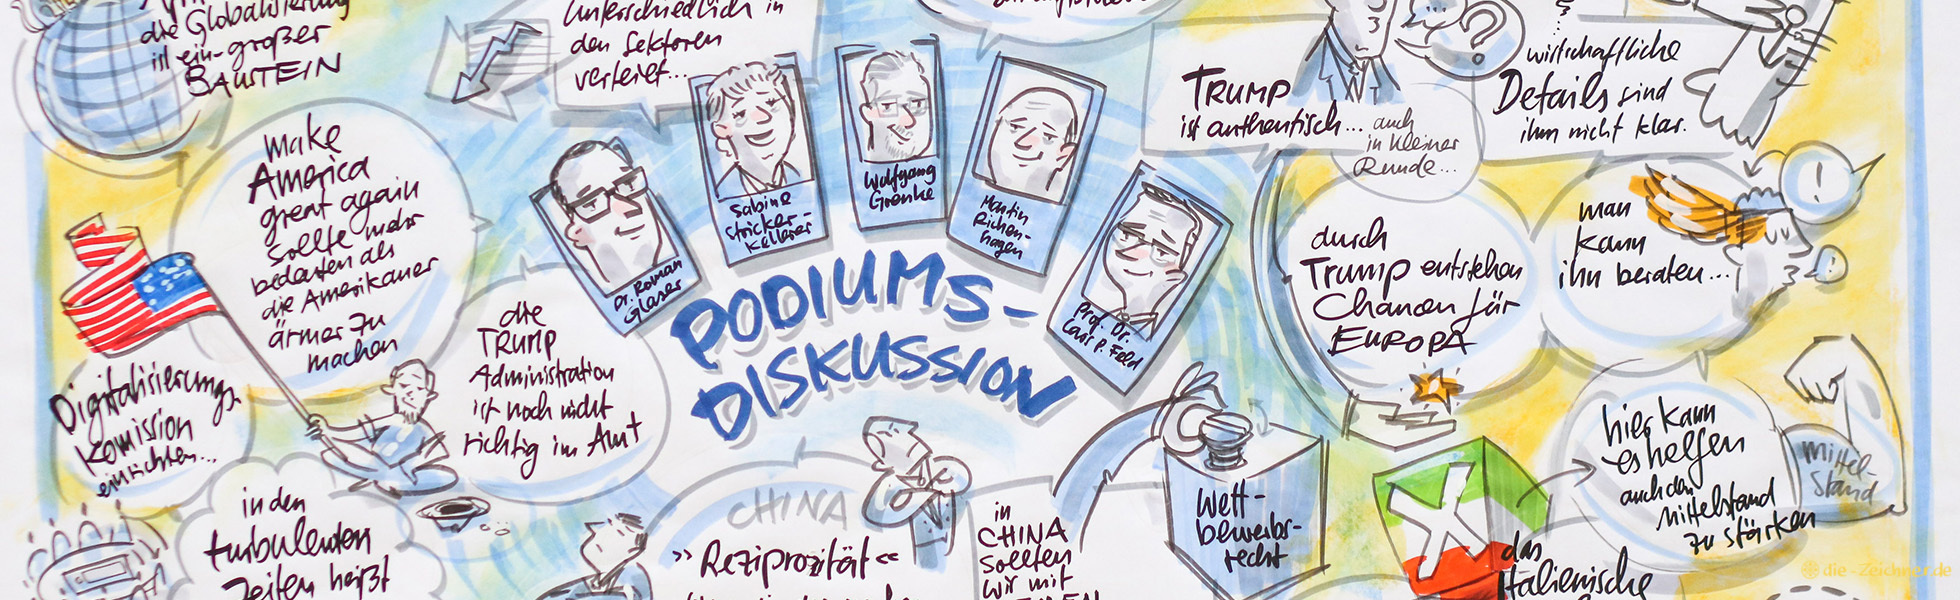
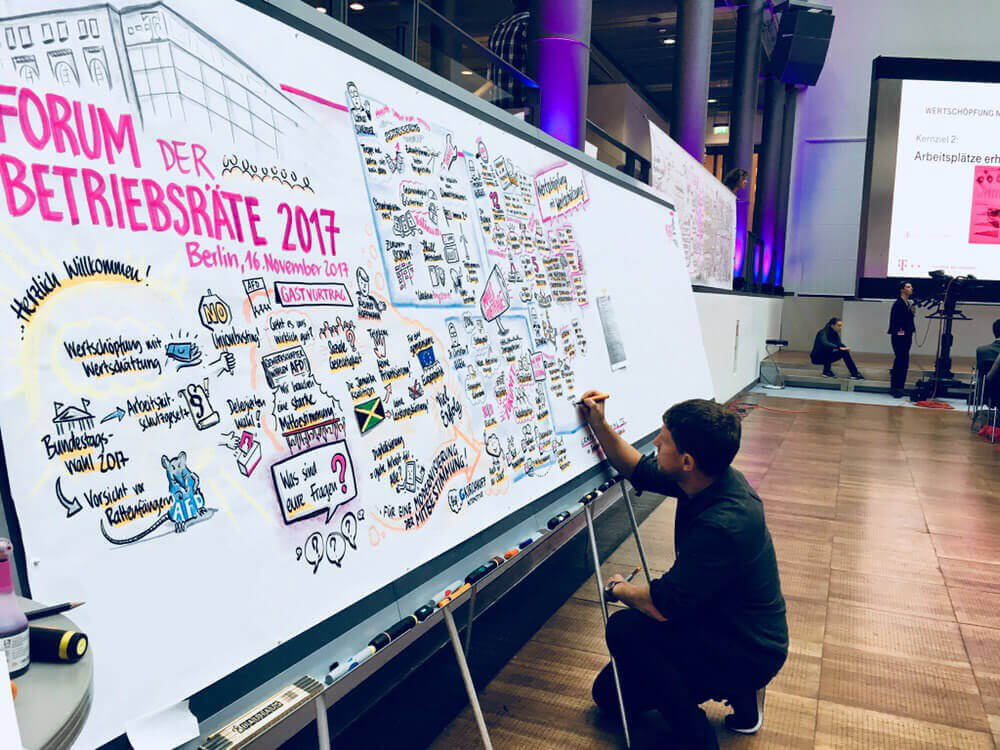
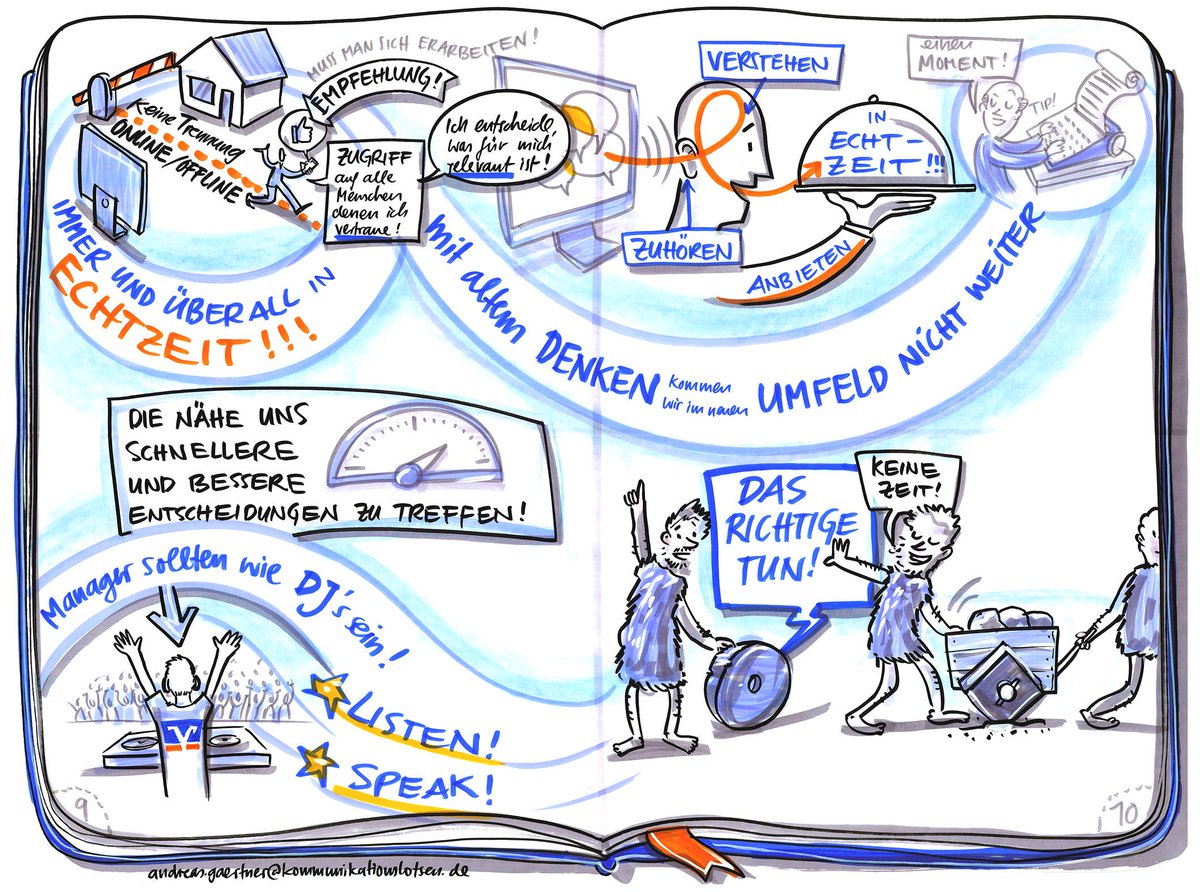
Graphic Recording is an american invention from the 70s. It is used at congresses, meetings, conventions, workshops and seminars to visually document the most important talking points and findings. It is done live at the event. The person recording is mostly using a big piece of paper and markers. Sometimes they can alternatively use a digital device that is streamed on a screen. Graphic recording has to be clear and conclusive, but can also be humorous.
This visualization technique is supposed to summarize long, complicated or boring talks as well as lectures and captures the most important information visually. This is done by using keywords, metaphors and pictures. It also includes the audience in the creative process and thus amplifies concentration and motivation. Another important factor of graphic recording is that our brain loves visual information and tends to remember it easier. It also has a more long lasting effect on us, because we think about an event longer than we normally would if we have a visual connection in our mind.
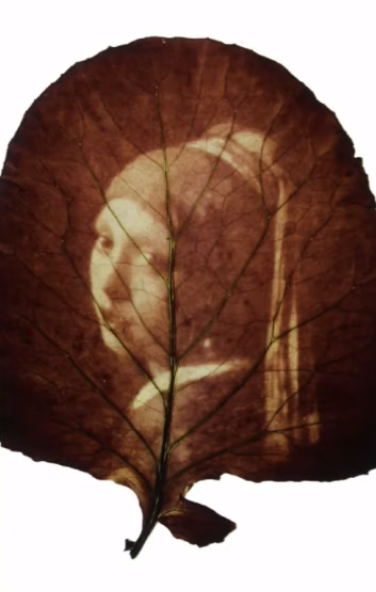
Ted talk by Vanessa Ruiz | TEDMED 2015 Medical Illustrator
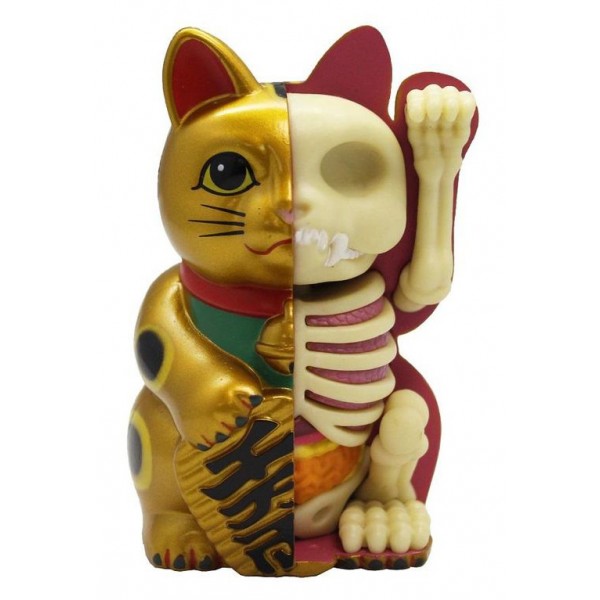
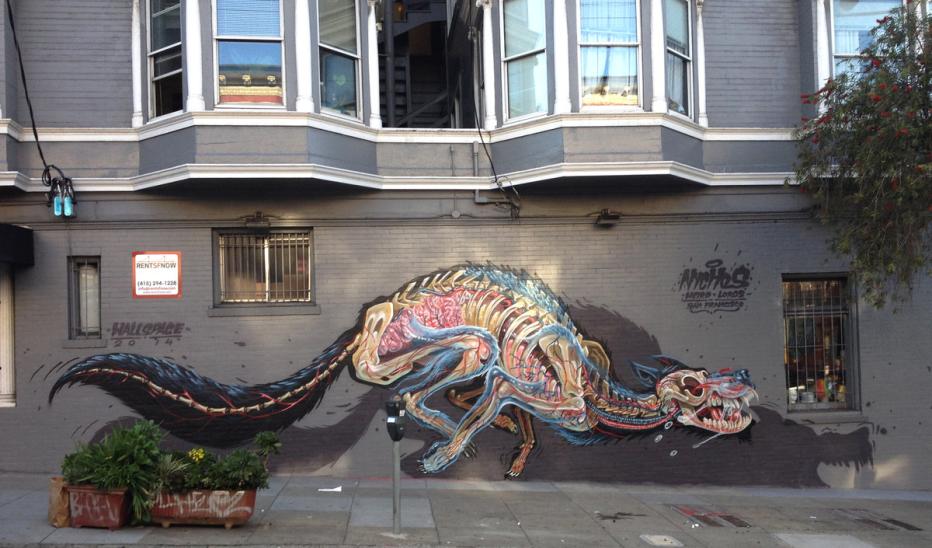
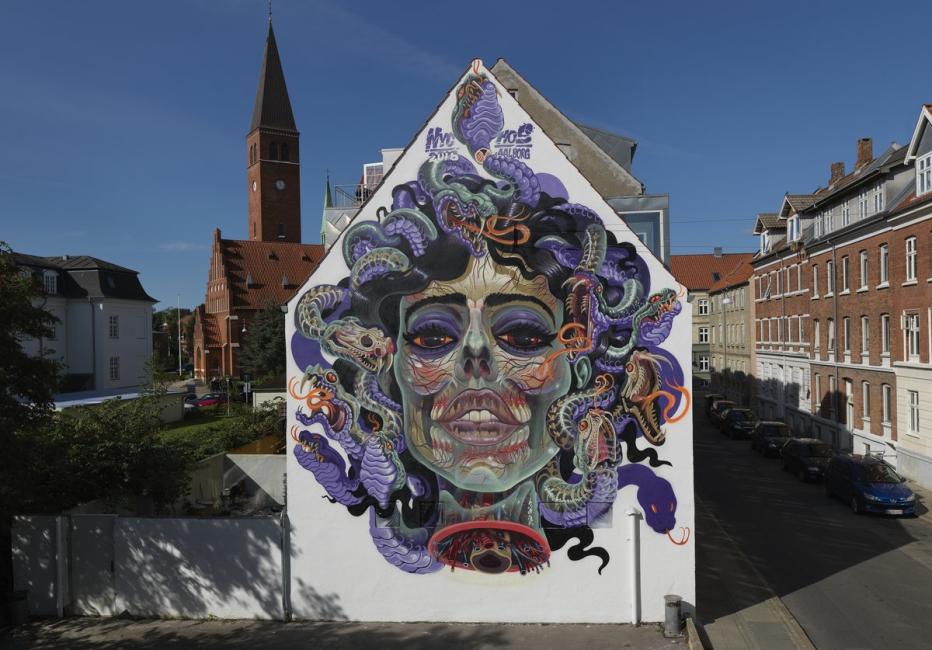
Vanessa Ruiz is a medical illustrator and loves the human body and anatomy. This is the reason why she created Street Anatomy, a movement dedicated to showcasing how anatomy is visualized in art, design and pop culture. Through sharing these works of art she wants to lift anatomy out of the textbooks, make it tangible and take away the learned reaction of fear of anatomy and guts most of us have.
In her Ted Talk at TEDMED 2015 she tells her story and relationship with anatomy, gives a short history recap and presents some of her favorite artists. Anatomy isn’t only relevant in the medical field and these artists bring it into the public space.
Jason Freeny
SHOK-1
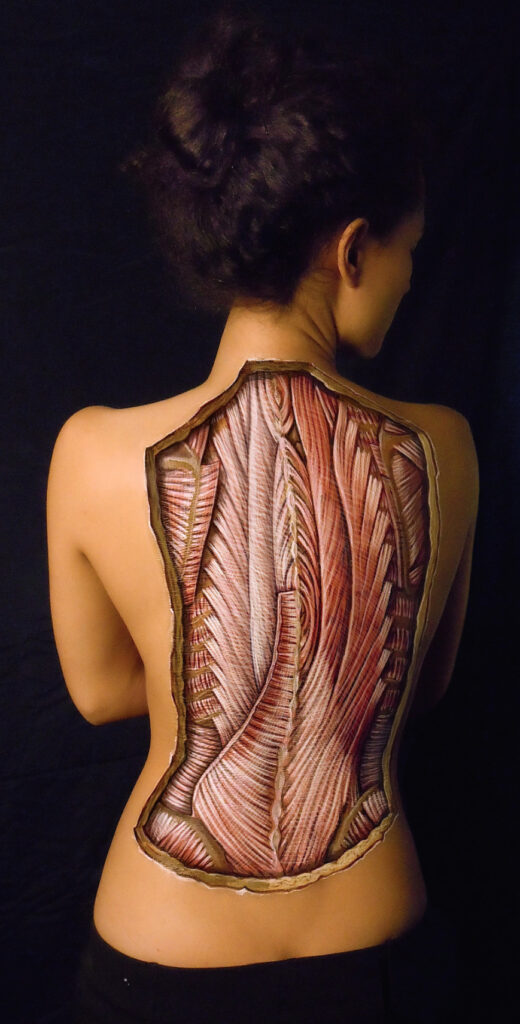
Danny Quirk
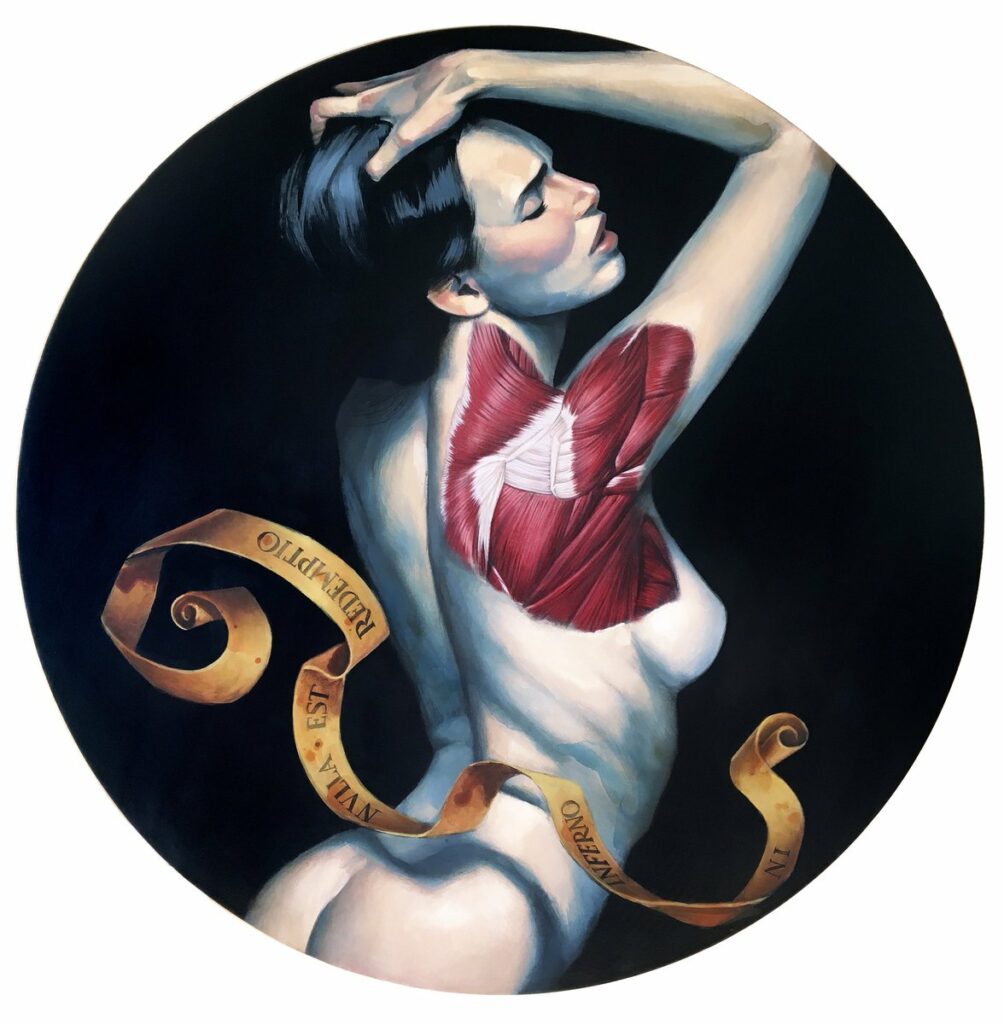
Fernando Vicente
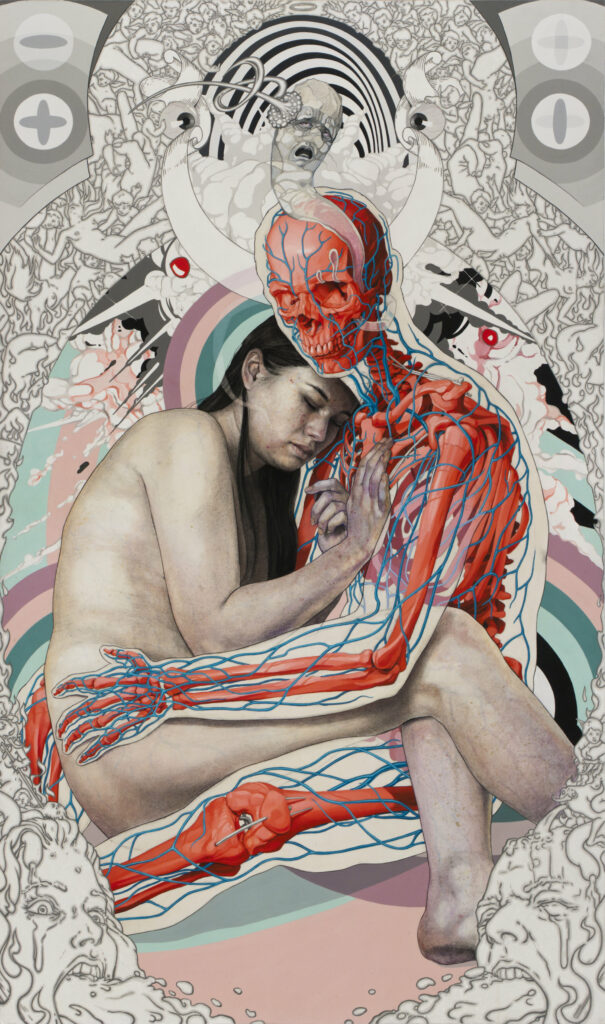
Michael Reedy
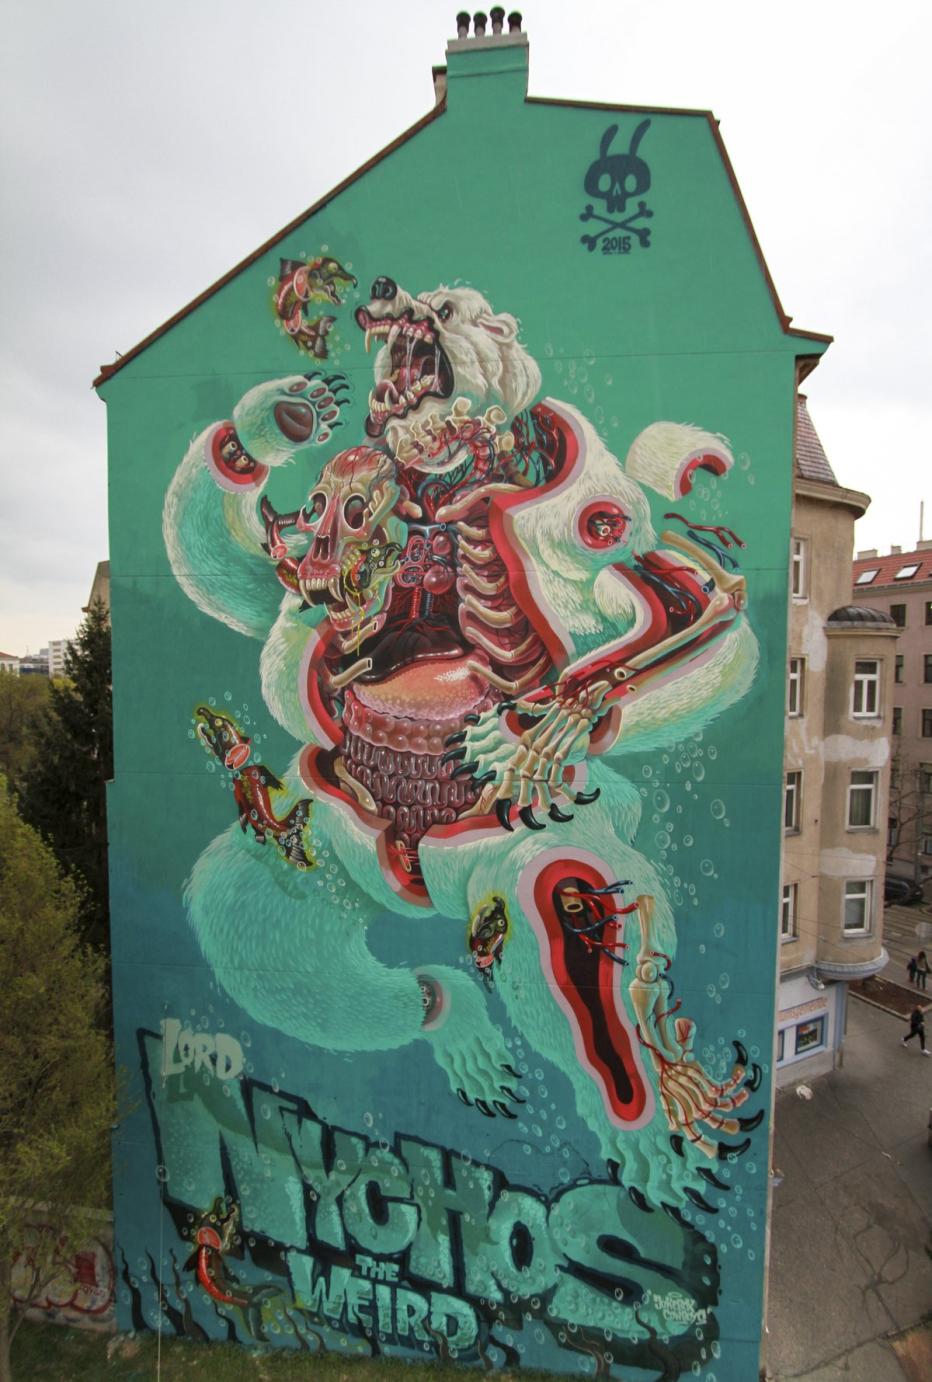
One of the artists Ruiz presents is the Austrian street artist and illustrator NYCHOS who created the Rabbit Eye Movement.
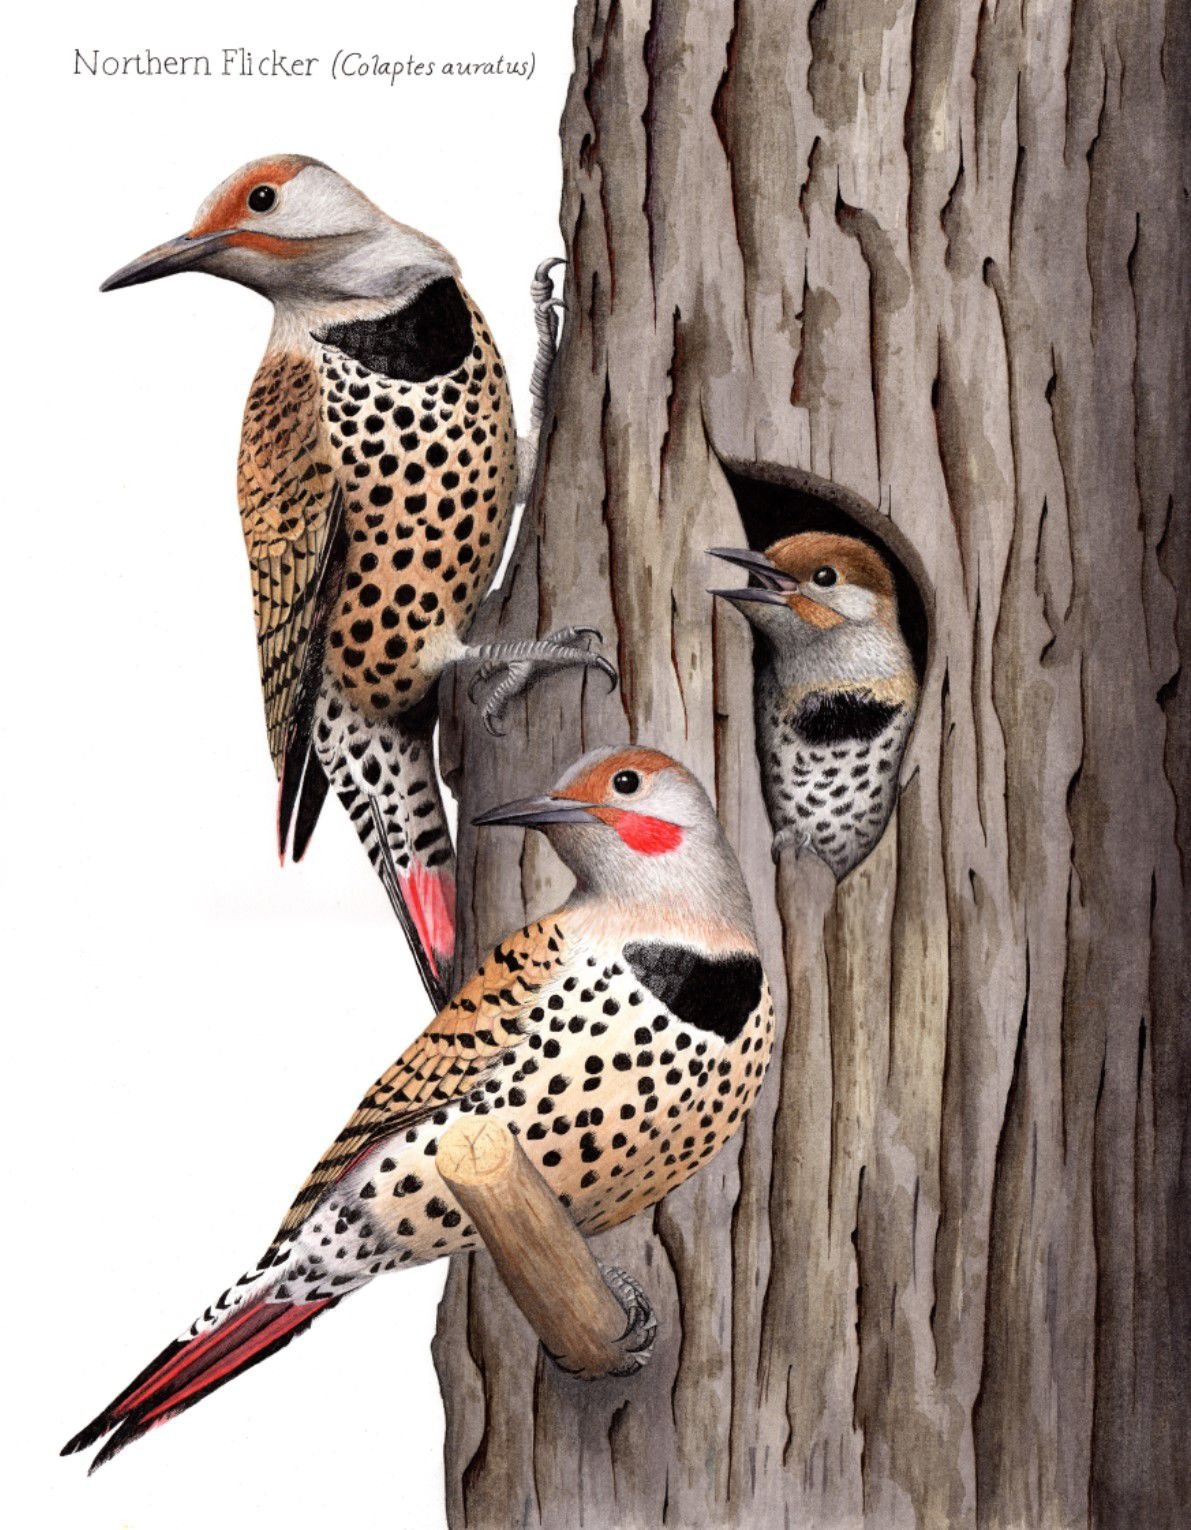
The main goal of scientific illustration is to translate scientific information into a visual representation that helps the reader or viewer to better understand the topic. Creating a scientific illustration involves multiple steps that may vary depending on the project.
At first the most important thing is to research the hell out of your subject! It may take some time, but it is extremely important to accurately share the information. When working with a scientist there will be provided information, but you still have to sit down and wrap your brain around it. Don’t forget to look at existing or similar work on the subject. It’s good to know what’s out there.
The next thing on your to-do list is to create preliminary sketches. Visualize what you have in mind and make as many sketches as you feel like. The more you sketch the more you can edit, revisit and adapt later on. You can also sketch the layout of the finished product (e.g. an informative poster) to get a feel for the needed space and dynamic of different parts.
After doing your sketching you can try out different illustration techniques. Will it be digital or analog? What color palettes will you use? By practicing and using different types of media and get a feel for which style fits your project best and find out how to get the best result.
Now that you made your sketches and tried different methods it is time to decide on the overall composition and transfer your drawing to editing software. Afterwards it’s time to start working on your final illustration. Once you get a first draft you can talk to the scientist that you cooperate with and discuss your illustration. Make it an iterative process and revise your illustration if needed. Once you and your collaborator are on the same page you can finalize the project.
I got this information from an article by Kara Perilli about making a scientific illustration on the Current, a blog from The Franklin Institute. She writes about the process in more detail and via example from her own project.
I also found this video about Nora Sherwood on her journey and career as a scientific illustrator. She is talking about her creative process, her desire to make people think about the world and nature as well as her wish to invoke curiosity and pass on knowledge.
Ralph Ammer shows how drawing can support our thinking in five ways and why drawing doesn’t have to be perfect. In his opinion drawing, like language, is a way to think and get in touch with other people. For him, drawing is not about art – it is bigger than art. It’s a way to think visually.
Drawing can ignite our intuition By doing little repetitive exercises we can improve the connection between our hand and eyes as well as give our hand a physical workout. The stronger the hand, the better we may control it to draw. These exercises can also function as some sort of meditation and soothe our minds. This can give more room for intuition.
–
Drawing can make the world more beautiful Normally the brain tunes out any unnecessary information. When we draw, we actually have to look and concentrate on the world around us. We see what is actually there. By drawing our surroundings we can store information in our mind and remember far better than as if we had just taken a photograph. One problem we might encounter is that our drawing doesn’t end up looking like our reference. The reason for this is that we tend to draw what we already know and not what we really see. By drawing the spaces between objects instead of the object itself we can trick our brain into not recognising shapes and make it easier for us to observe. _
We don’t find beauty. We make the world beautiful by paying attention.
Drawing helps us understand We can try to draw what is unseen, like our thoughts and emotions. By choosing a subject and placing it on different positions within our canvas we can create different contexts. Ammer tries to draw his thoughts every day. They represent his thoughts about the world and can be grouped and rearranged to see connections and patterns. _
Drawing can help us to imagine new things For Ammer an idea is what happens if two or more thoughts collide. By combining one thought with many other different thoughts you get a lot of ideas. After just writing everything down that you came up with you can sort out what might not work. An idea that seemed bad at first might turn out as the one that fits best for your purpose. _
Creativity really is like breathing. You take in information and knowledge and you combine it to new ideas that you emit.
Drawing helps us communicate with others Images help to make words stick in your mind, because words alone are sometimes hard to take in. With drawings you can lead others through your thought process and help them to connect the dots and understand your idea. For that to work, the drawing has to be original and personal. _
Our drawings do not have to be pieces of art. If they help us to think, they are good enough.
Ralph Ammer
On Ralph Ammer’s website he writes about about all those topics and many others more in detail. Some interesting articles of his:
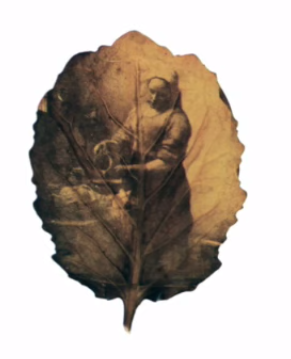
Ted talk by Ikumi Kayama Medical and scientific illustrator
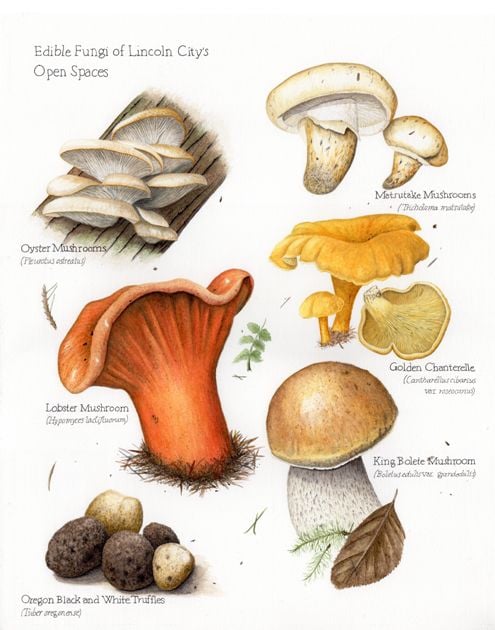
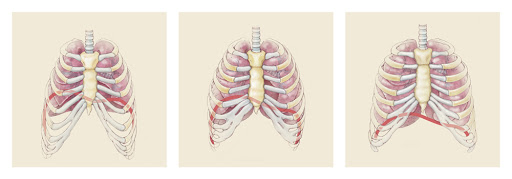
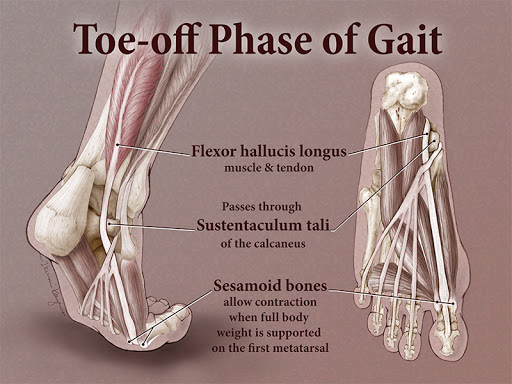
Ikumi Kayama shares what scientific illustration means to her and what motivates her to keep going. In her work she creates illustrations of “dead things”. They could be plants, animals or humans. One of her focuses is human anatomy and she loves to give new insight about the human body to other people. Kayama emphasizes that the advantage of illustration over photography is that she can breath life into her drawings, make things see-through and direct the viewer’s eye to a specific point of the picture.
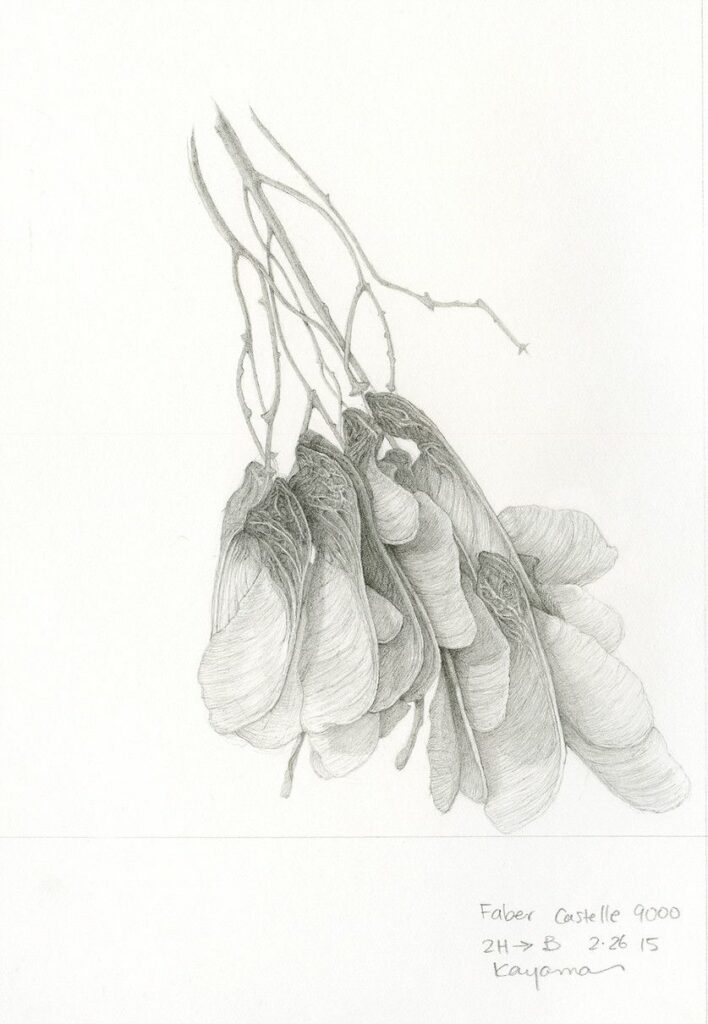
Some of Ikumi Kayamas work:
Integration of Art and Science
Ted talk by Yoko Shimizu Contemporary artist and biochemist
Yoko Shimizu talks about the beauty of science, the way it inspires her and how she uses scientific principles to create fascinating installations. In her talk she shows three art installations about gravity, surface tension and sound waves. With her work she wants to show everyone that inspiration is all around us and that combining things that seem on different ends of a spectrum can lead to astonishing and beautiful creations. Visualizing the unseen is one of her key motivations.
Inside Futurelab – BioArt
Video by Ars Electronica
In this video Yoko Shimizu presents the Ars Electronica Futurelab, where they create creative and innovative technology with clients from around the world. Shimizu gives the viewers a quick tour of the Ars Electronica Biolab, which consists of two floors, a museum/galerie and laboratory. Afterward Shimizu talks about BioArt, her motivation and projects. She loves that in BioArt you start with something you designed but in the end you end up with something you couldn’t even imagine by co-creating with nature and living things.
It’s much more beautiful than something that you could’ve created on your own.
When science meets art
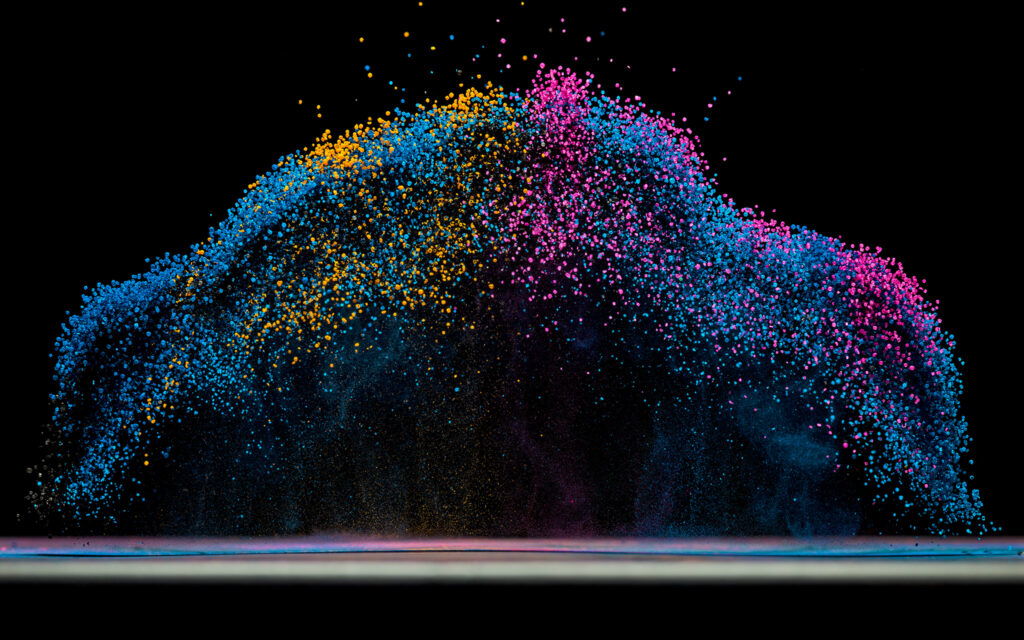
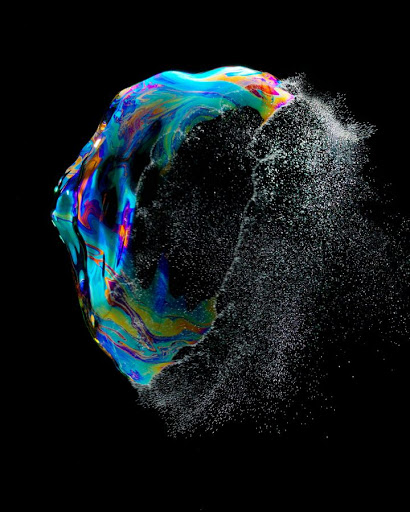
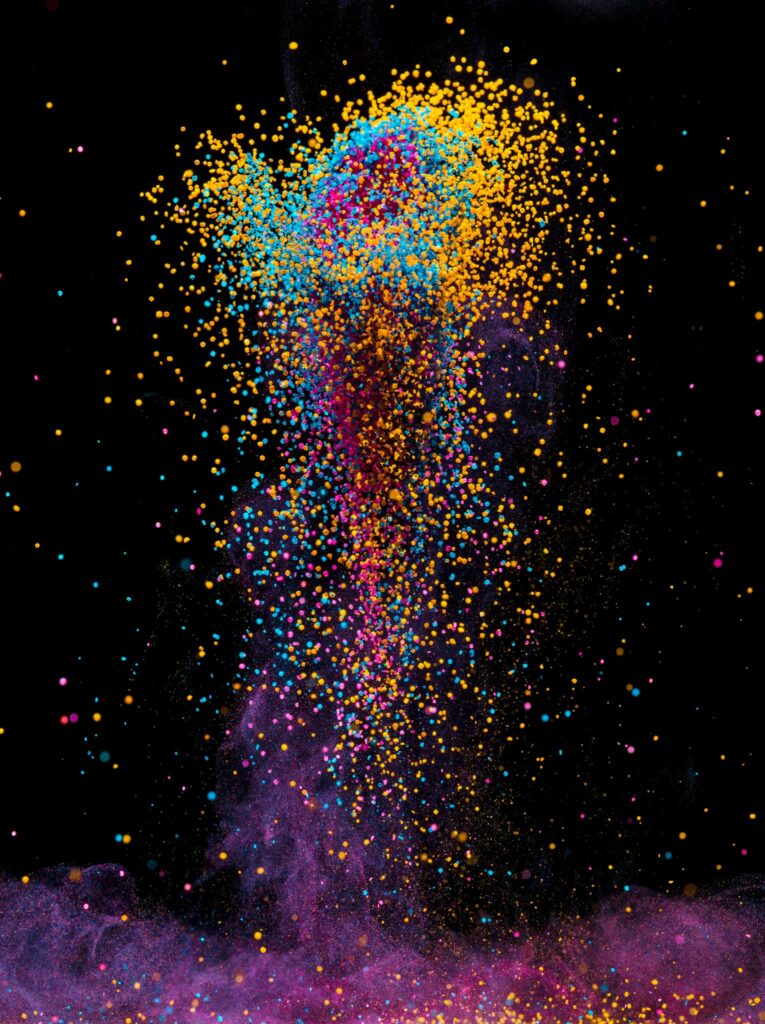
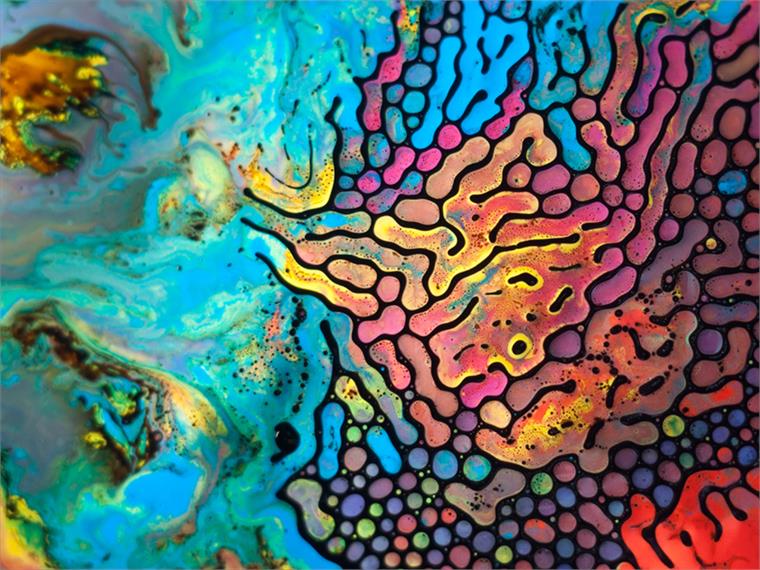
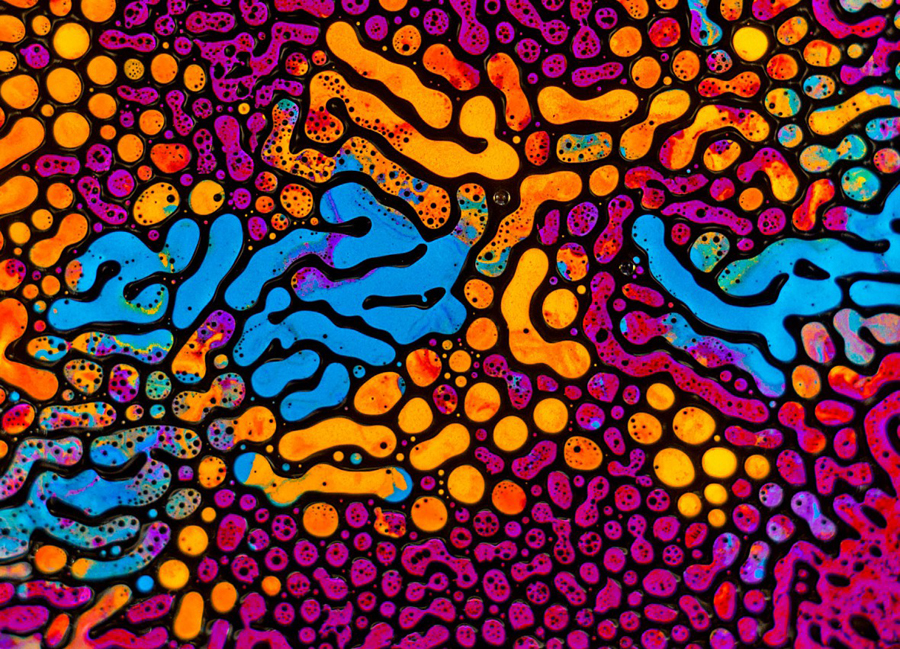
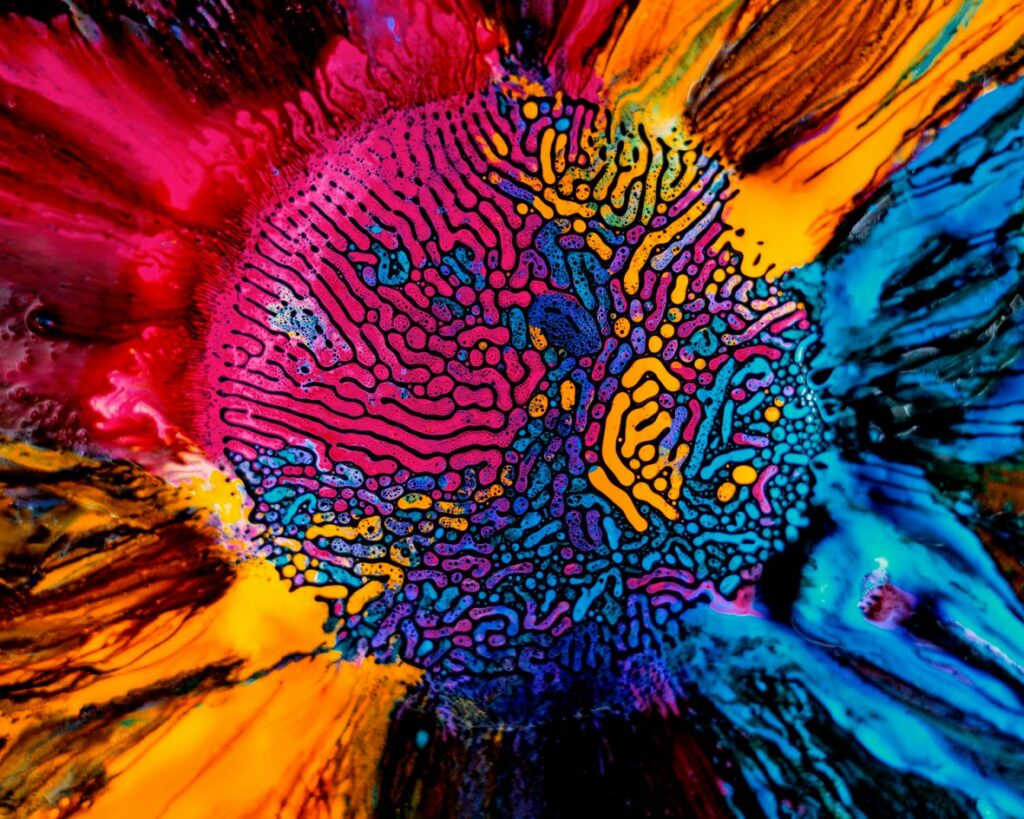
Ted talk by Fabian Oefner Artist
Fabian Oefner presents two of his projects inspired by science. The first one is based on sound waves. Tiny crystals are placed on a plastic foil above a speaker. They jump in the air once a sound is played. Using a camera that can take 2000 pictures per second he photographs this phenomenon. In his second project he uses ferrofluids (fluids that react to magnetic fields) and watercolors to create amazing organic images. Each of his projects is somehow inspired by science, because he doesn’t just want to create stunning images but wants to make people curious as well. His goal is to make the viewer stop for a moment and wonder how he did it and what the physical properties are.